Watching Cancel-to-Trade Ratio Drift in Real Time: What Batch Reports Miss Before the Flag Arrives
Introduction
I have watched a single futures contract’s cancel-to-trade ratio sit at 60:1 for three minutes while the same instrument’s daily file ended at 14:1. Across the session, that kind of intraday spike contributes to five-to-six-figure CME messaging surcharges accumulating before the post-session report ever lands. The 3-minute window was invisible to the desk’s end-of-day report. By the time the post-session CSV arrived, the messaging-fee tier had already tripped, the exchange’s surveillance queue had already flagged quote-stuffing-adjacent activity, and a regulatory file was already open.
This is the monitoring gap that CTR (cancel-to-trade ratio) exposes in plain sight on every electronic market where a desk is streaming depth. The metric has been documented in academic research for over a decade. Exchanges have been publishing message-to-trade ratio surveillance frameworks under MiFID II RTS 9 for years. And yet on most buy-side and prop desks I have audited in 20+ years of production HFT infrastructure, the monitoring dashboard tracks fills, volume, and P&L. The cancel side of the book is not on the screen.
This article is for CTOs and Heads of Electronic Trading asking the right question: what is live in my book that my end-of-day report cannot surface, and where is the cost of not seeing it compounding?
VisualHFT running live. Cancel-to-trade ratio updating on the volume clock, not the time clock. The slope on screen is what the daily CSV will smooth away.
What CTR Actually Measures, and Why the Daily Mean Is the Wrong Cadence
At its simplest, cancel-to-trade ratio is the count of cancel messages divided by the count of execution messages over some observation window. That window is where the information lives.
At daily cadence on a liquid contract, CTR is a descriptive statistic. It tells you whether the venue’s overall microstructure leans heavy on cancels (which most modern electronic markets do; the SEC’s 2014 Equity Market Structure Literature Review surveys findings documenting cancellation rates exceeding 95% of submitted orders across most venues), or runs close to execution-dominant. That daily number is useful for venue-level comparisons and longitudinal trends. It is insufficient for intraday risk management.
At sub-second cadence, CTR behaves very differently. On a single contract at 14:1 daily mean, you can see three-minute windows where the ratio spikes to 60:1 while the book is thin. You can see cancels cluster disproportionately on one side of the book during regime shifts. You can see refresh latency widen as market makers hedge adverse selection risk by pulling quotes faster than they replace them.
These intraday spikes are not hypothetical. Gao and Mizrach’s empirical analysis of documented quote-stuffing episodes (Rutgers working paper series) found CTR ratios spiking well above baseline in confirmed manipulation cases. Practitioner-observed intraday spikes on thin liquidity regularly exceed academic case-study ranges. The distribution of intraday CTR is not Gaussian. It has fat tails on the upside, and the tails are where the operational cost lives.
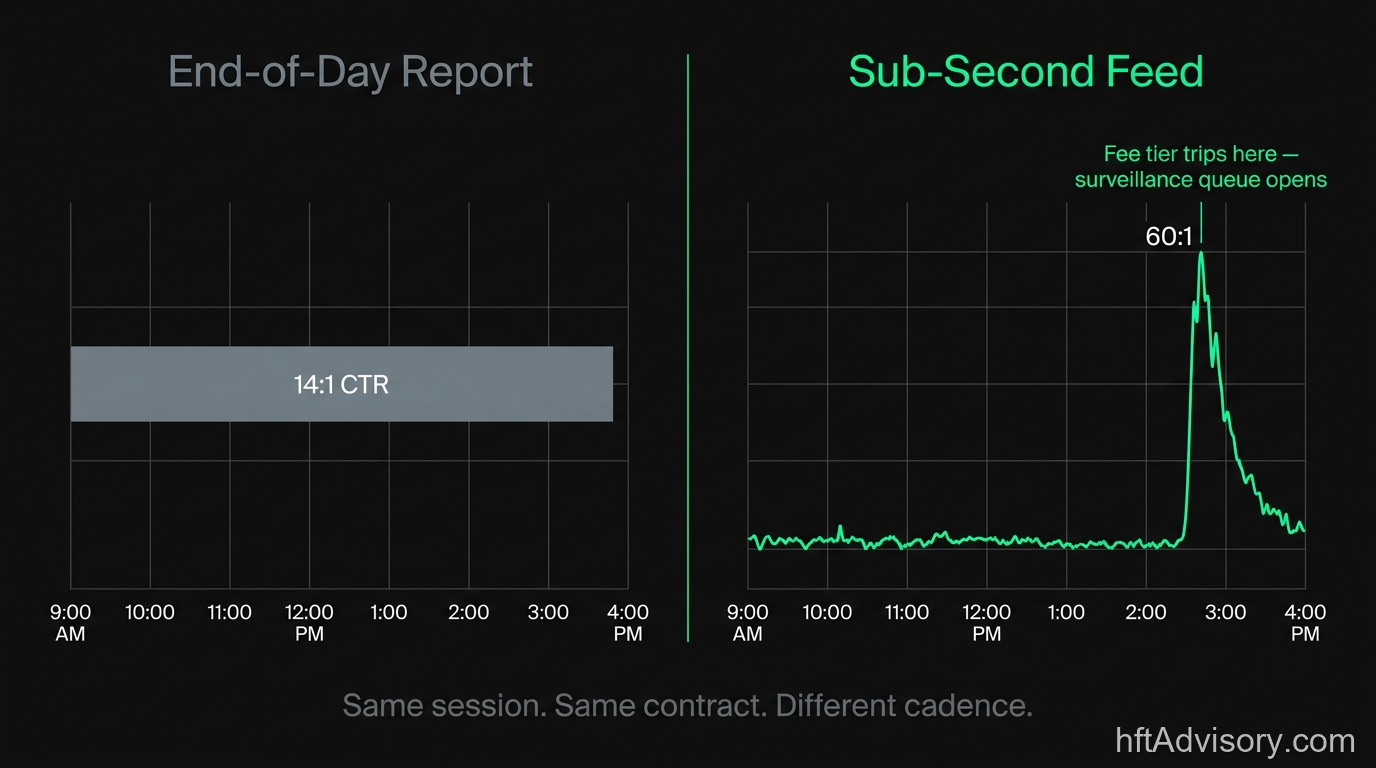
Same session, same contract, different cadence. The daily aggregate flattens the 3-minute window where the fee tier trips and the surveillance queue opens.
The operational point: CTR as a time-series signal at sub-second cadence carries information that CTR as an end-of-session scalar does not.
The Counter-Intuitive Research Frame: Higher CTR Does Not Mean More HFT
Here is the reading that most desks get backwards. Intuition says: high cancel-to-trade ratio means heavy HFT activity, because HFTs place and cancel aggressively. The empirical literature points the other way.
In a prior article on this blog, Decoding the Cancellation-to-Trade Ratio, I walked through the inverse relationship. Stocks with deeper HFT liquidity provision often exhibit lower cancel-to-trade ratios. The drivers are tick size and adverse selection risk.
Bartlett and McCrary’s analysis of the SEC’s 2016 Tick Size Pilot Program, Subsidizing Liquidity with Wider Ticks (SSRN 3076257, 2017 working paper, published 2020 in the Journal of Empirical Legal Studies), established that tick size materially shifts market-making economics, quote-refresh dynamics, and adverse selection costs. The SEC’s own DERA working paper on the Tick Size Pilot confirmed adverse selection price impact increased by two to four basis points across test groups with wider ticks. A smaller tick size means tighter price priority competition, more frequent quote refreshes, and more cancels per execution. That is structural, before any manipulation enters the picture.
Hasbrouck and Saar (2013, Journal of Financial Markets) documented that higher HFT participation correlates with tighter spreads and improved liquidity. Brogaard’s 2010 working paper on high frequency trading and market quality (NASDAQ-data working paper, widely cited) confirmed HFTs provide best quotes disproportionately often. Neither paper frames its findings as “lower CTR equals better HFT provision,” but the operational inference is directionally consistent with the microstructure literature: when HFT market-makers are providing deep, stable liquidity, they are cancelling less per execution. When they are providing thin, flickering liquidity under adverse selection pressure, they are cancelling more.
The practitioner takeaway: read CTR as a composition signal, a measure of the makeup of quote-refresh activity in the book. A high ratio with tight spreads and deep book reflects healthy quote-refresh activity on a narrow tick. A high ratio with widening spreads and disappearing depth reflects market-makers stepping back under adverse selection pressure, or worse, manipulation.
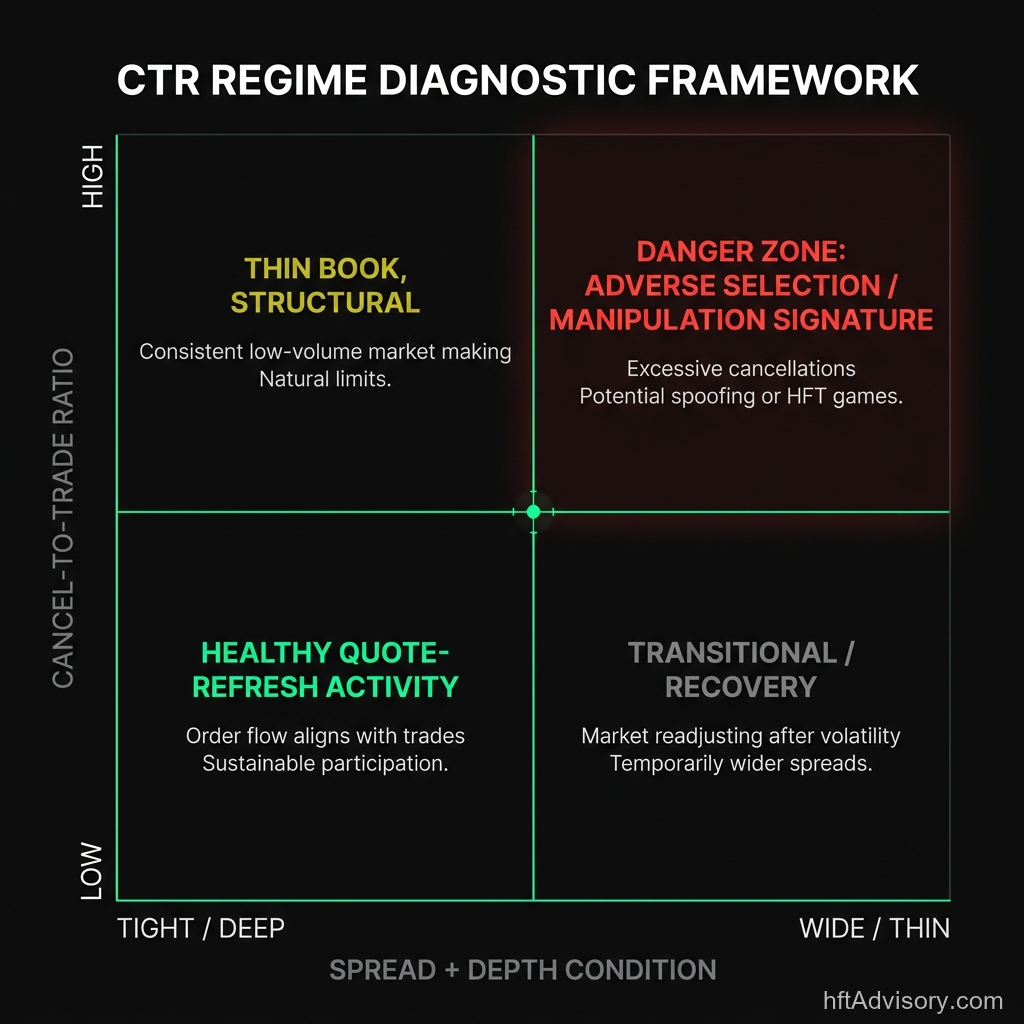
CTR is a two-variable diagnostic. Ratio level alone does not resolve to a regime. Spread and depth condition complete the read.
You cannot distinguish these two regimes at daily cadence. You can distinguish them in real time.
The Regulatory Layer: Where Cancel-Heavy Flow Becomes Real Money
The regulatory and fee-tier infrastructure for cancel-message monitoring is mature, specific, and expensive when ignored.
CME Group publishes the Globex Messaging Efficiency Program (MEP), currently at version 11.7, with an effective date of October 1, 2024. MEP imposes messaging surcharges when a participant’s mass-quote volume ratio exceeds product-group thresholds. Surcharge rates are per-message, and at the intraday spike ranges practitioners observe, five to six figures in messaging fees can accumulate within a handful of sessions before the post-session report is generated.
CME Rule 575, effective since September 15, 2014, explicitly prohibits quote stuffing and other disruptive trading practices. Enforcement is real. The rule addresses behavior where order flow does not reflect genuine trading intent.
Eurex operates an Order-to-Trade Ratio (OTR) framework under MiFID II RTS 9. The framework requires trading venues to calculate unexecuted-order-to-trade ratios and enforce limits. Eurex publishes its TR100 OTR report at 30-minute intraday intervals (from 1:30 to 21:30 CET for most products), meaning the exchange itself is monitoring the metric at a cadence finer than most buy-side desks track their own order flow.
MiFID II RTS 9 is the binding regulation. Trading venues in the EU are legally required to monitor and enforce message-to-trade ratios. This is not a suggestion. The surveillance is happening whether a desk is watching its own activity or not.
NSE India was among the first exchanges globally to adopt OTR fees. The framework has since been adopted in various forms across major electronic venues worldwide.
The monitoring gap: the exchanges are watching at intraday cadence. Most buy-side desks are watching at end-of-day cadence. The exposure window (the time between “the ratio started drifting” and “the post-session report flagged it”) is hours long. On a thin-liquidity session, that window is where the fees compound.
Three Regime Markers Live Monitoring Surfaces Before the Daily File
What does real-time CTR monitoring actually show that batch reconstruction does not?
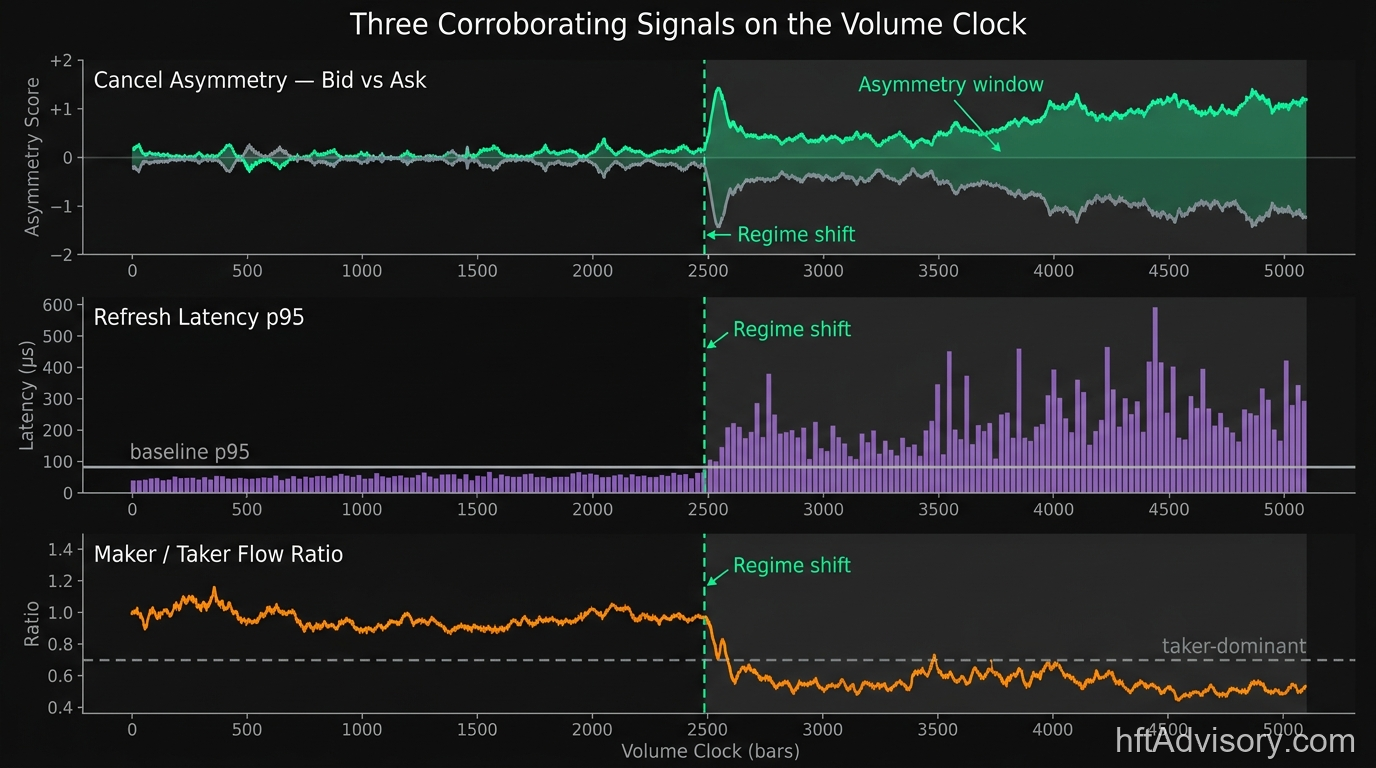
Three corroborating signals on the same volume clock. The regime-shift marker aligns across all three panels. Batch reconstruction blends them into an aggregate that shows none of the three.
1. Cancel Clustering on One Side of the Book
In a healthy book, cancels distribute roughly symmetrically across bid and ask levels. During a regime shift (whether driven by fundamental news, liquidity withdrawal, or manipulation), cancels cluster disproportionately on one side.
The Hawkes-process literature on order book dynamics (Bacry, Mastromatteo, Muzy, and related empirical work) documents that cancellations exhibit self-exciting clustering behavior under stress. On the monitoring dashboard, this appears as a sustained asymmetry: bid-side cancel count running three to five times ask-side cancel count (or vice versa) over consecutive volume bars.
The daily mean smooths this away entirely. A session that was bilaterally balanced on cancels for 95% of the day and asymmetric for 5% will show a symmetric daily ratio. The 5% window is when execution quality degrades and fills erode margin.
2. Refresh Latency Widening
Under normal conditions, a market maker who pulls a quote replaces it within milliseconds. The refresh latency (the time from cancel message to next-quote message on the same side at a comparable price level) is a direct measure of how aggressively market makers are recommitting capital.
When refresh latency widens, market makers are recommitting more slowly. That is a structural signal of adverse selection pressure. The dealer-inventory literature going back to Stoll’s 1978 framework established the link clearly: when the perceived toxicity of incoming flow rises, the risk-adjusted cost of providing liquidity rises, and dealers respond by widening spreads, reducing size, or slowing refresh.
Watching the refresh-latency distribution shift in real time (the distribution, not the mean) is how a desk sees market makers becoming cautious before the spread number on the screen reflects it.
3. Maker-to-Taker Flow Rotation
The ratio of maker-initiated to taker-initiated executions shifts during regime changes. In a healthy book, the ratio is relatively stable. Under pressure, taker flow dominates as aggressive participants cross the spread to close positions, and maker flow thins as passive quoters widen out.
Combined with cancel clustering on the withdrawing side, maker-to-taker rotation is a corroborating signal. The book is being dismantled on one side, and aggressive flow is concentrating on the other.
These three signals compose what CTR is actually measuring when rendered at the right cadence. Real-time monitoring surfaces them as simultaneous, corroborating pattern changes. Batch reconstruction blends them into an aggregate that shows none of the three.
The Monitoring Stack That Actually Surfaces This Information
After 20+ years building production HFT infrastructure, and auditing the monitoring gaps on institutional and prop desks, here is the minimum architecture for a stack that can see CTR regime shifts in real time.
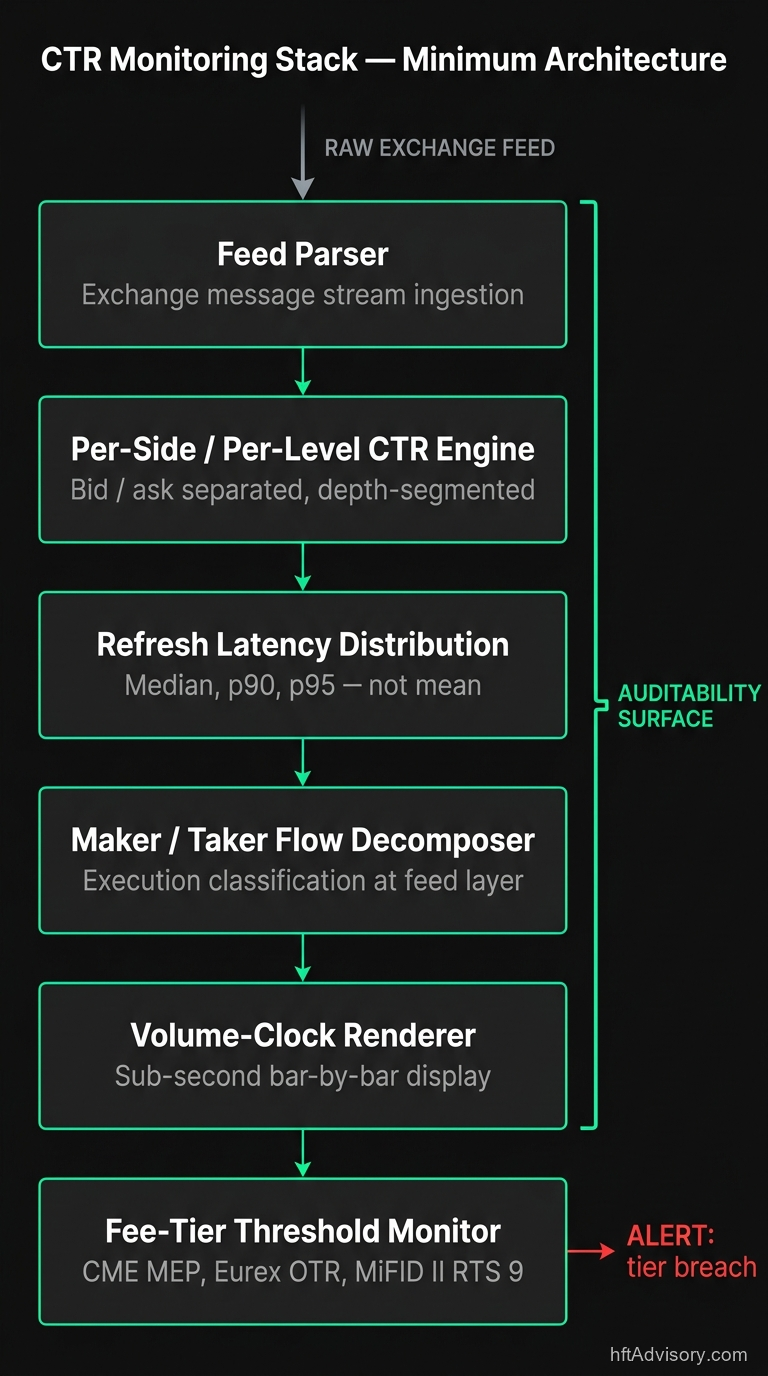
Six sequential layers from raw exchange feed to fee-tier threshold alert. The auditability surface spans every layer: every metric’s computation is traceable to source code.
1. Per-Side, Per-Level CTR Computation
- Segregate cancel counts by bid side and ask side. A unified book-wide count smooths away the asymmetry signal
- Segregate by depth level (top-of-book, levels 2 through 5, deep book). Top-of-book cancels are a different signal than deep-book cancels
- Update on the volume clock, not the time clock, so the metric stays synchronized with book turnover rather than wall-clock artifacts
2. Refresh Latency Distribution Tracking
- Measure the interval from cancel message to next-quote on the same side at comparable price levels
- Track the distribution (median, p90, p95), not just the mean
- Alert on distribution shifts. A p95 widening is often the earliest signal of market-maker caution
3. Maker/Taker Flow Decomposition
- Classify every execution as maker-initiated or taker-initiated at the feed-parsing layer
- Track the rotation ratio on the volume clock
- Combine with cancel-side asymmetry to corroborate regime-change signals
4. Sub-Second Dashboard Rendering
- The entire value of this monitoring is temporal. Rendering must be at bar-by-bar granularity a Head of Desk can act on
- Time-clock rendering loses fidelity during volume bursts; volume-clock rendering preserves it
5. Exchange Fee-Tier Tracking
- Integrate the venue’s published messaging-fee schedule (CME MEP, Eurex OTR under RTS 9, NSE OTR)
- Compute running fee accrual in real time, not post-session
- Surface tier-breach warnings before the exchange’s own surveillance does
6. Auditability
- Every metric’s computation must be traceable to source code
- Threshold parameters must be documented with calibration rationale
- Distribution assumptions (daily mean, p95, p99) must be instrument-specific and re-validated periodically
Where VisualHFT Fits
I built VisualHFT after two decades in production HFT infrastructure specifically because this monitoring gap kept appearing on every desk I worked with. A dashboard showing fill rate, slippage, and P&L is describing outcomes. A dashboard showing CTR segmented by side and depth, refresh-latency distribution, and maker-taker rotation is describing the market condition you are executing into.
VisualHFT surfaces the above in real time against live exchange feeds. The Cancel-to-Trade Ratio study is a native computation in the VisualHFT rendering engine, alongside the VPIN study, the LOB imbalance study, OTT/TTO ratios, and the Market Resilience indicator. Everything updates on the volume clock. The same codebase that renders CTR live also renders the other microstructure studies that compose a complete real-time monitoring stack.
Current state of the project:
- 1,100+ GitHub stars
- 230+ forks
- 510+ commits
- Apache-2.0 license (free for any use, including commercial)
- C# / .NET 8.0
- Plugin architecture with 8 exchange connectors
- Studies implemented as independent plugins, each metric its own auditable module
The auditability argument matters. Bloomberg Terminal is approximately $31,980 per seat per year (single-seat pricing, post-2025), and does not publish its microstructure analytic computation methodology. When a metric moves on a Bloomberg screen, the computation is opaque. For an institution that needs to demonstrate to regulators, auditors, or its own risk committee exactly what a metric is computing and why a threshold triggered an action, opacity is a liability.
VisualHFT is 500+ commits of readable, forkable, auditable code. When CTR spikes, you trace exactly what is being computed: the cancel-message classifier, the execution-message classifier, the volume-clock bucketing logic, the per-side segmentation. You can extend it. You can validate against your own instruments. You can modify threshold parameters and document why.
FINRA Rule 6151, effective June 30, 2024, centralizes Rule 606(a) order-routing disclosure through FINRA infrastructure. Execution-quality documentation demands are tightening globally. The ability to explain your monitoring stack (not just assert that it exists) is becoming a regulatory differentiator, not just a P&L one.
The community version is available now. Clone the repository on GitHub. The plugin architecture means you can add your venue’s connector if it is not already supported, and the core studies run against the unified plugin interface.
Conclusion
The regulatory infrastructure for cancel-message surveillance is mature. The academic literature on CTR as a composition signal is settled. The exchanges are monitoring at 30-minute intraday cadence under binding MiFID II requirements. The fee tiers that trigger on message-volume ratios are priced in five-to-six-figure ranges for active participants.
The infrastructure gap on the buy-side is the monitoring cadence. A 14:1 daily mean that hides a 3-minute window at 60:1 is the operational reality of a thin-liquidity market-making regime. The cost compounds across sessions until the post-session report finally flags it.
The diagnostic question is specific: at sub-second cadence, segmented by side and depth, with maker-taker rotation and refresh-latency distribution tracked alongside, what is your book actually showing about the composition of the flow you are executing into?
If your answer is that your TCA runs post-trade on the daily aggregate, the gap is not theoretical. The exchange’s surveillance queue is already watching at finer cadence than your dashboard.
References
- Gao, C., & Mizrach, B. “Quote Stuffing and Market Quality.” Rutgers University working paper.
- Bartlett, R. P., & McCrary, J. “Subsidizing Liquidity with Wider Ticks: Evidence from the Tick Size Pilot Study.” SSRN 3076257 (2017 working paper; published 2020, Journal of Empirical Legal Studies).
- U.S. Securities and Exchange Commission, Division of Economic and Risk Analysis (DERA). “Assessment of the Tick Size Pilot Program.”
- Hasbrouck, J., & Saar, G. (2013). “Low-Latency Trading.” Journal of Financial Markets, 16(4), 646–679.
- Brogaard, J. (2010). “High Frequency Trading and Its Impact on Market Quality.” NASDAQ-data working paper.
- CME Group (2024). Globex Messaging Efficiency Program (MEP), Version 11.7, effective October 1, 2024.
- CME Group. Rule 575, Disruptive Trading Practices (effective September 15, 2014).
- Eurex Exchange. Order-to-Trade Ratio Framework under MiFID II RTS 9. TR100 intraday report.
- European Securities and Markets Authority (ESMA). MiFID II RTS 9, Order-to-Trade Ratio.
- FINRA Rule 6151, Disclosure of Order Routing Information (effective June 30, 2024).
- U.S. Securities and Exchange Commission (2014). Equity Market Structure Literature Review, Part II: High Frequency Trading.
- Stoll, H. R. (1978). “The Supply of Dealer Services in Securities Markets.” Journal of Finance, 33(4), 1133–1151.
- Bacry, E., Mastromatteo, I., & Muzy, J.-F. (2015). “Hawkes Processes in Finance.” Market Microstructure and Liquidity.