Detect market-structure changes earlier
Feature reference: Microstructure Analytics Foundation
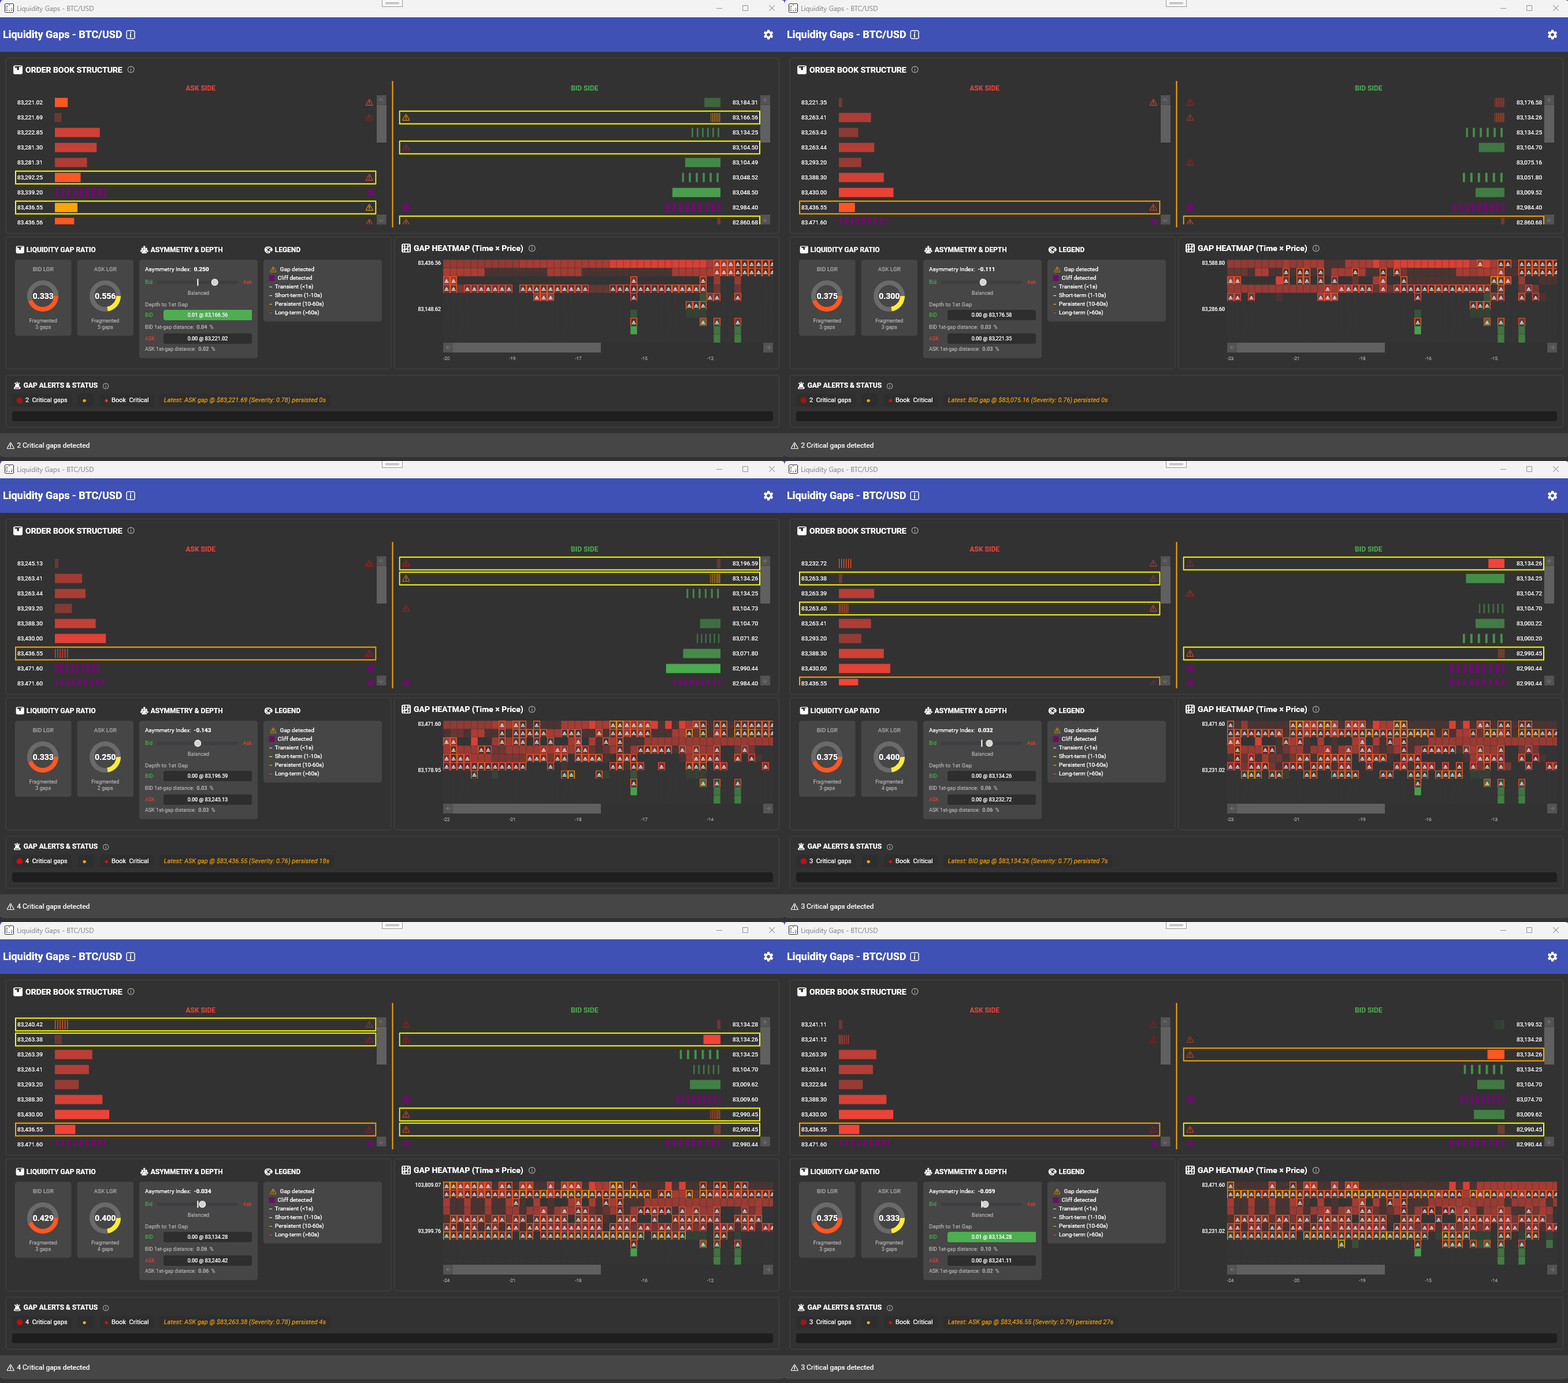
See liquidity withdrawal, imbalance shifts, toxic flow, spread instability, and resilience deterioration while conditions are still developing.
See liquidity deterioration, toxic flow, execution risk, and changing market conditions as they develop—not after they disappear into logs and post-trade analysis.
Real-time market microstructure intelligence for quantitative trading teams.
VisualHFT gives quantitative teams continuous visibility into the market structures and system behaviors that determine execution quality, strategy performance, and operational risk.
Feature reference: Microstructure Analytics Foundation
See liquidity withdrawal, imbalance shifts, toxic flow, spread instability, and resilience deterioration while conditions are still developing.
Feature reference: High-Resolution Processing
Connect order-book behavior, trades, venue conditions, and system performance to identify what is affecting fills, slippage, and strategy behavior.
Feature reference: Replay, Capture & Research Workflows
Capture and replay the conditions surrounding an event to reconstruct what happened, in what sequence, and why.
Feature reference: Microstructure Analytics Foundation
Observe how strategies interact with changing liquidity, market pressure, and execution conditions before problems compound.
Feature reference: Real-Time Market Data Pipeline
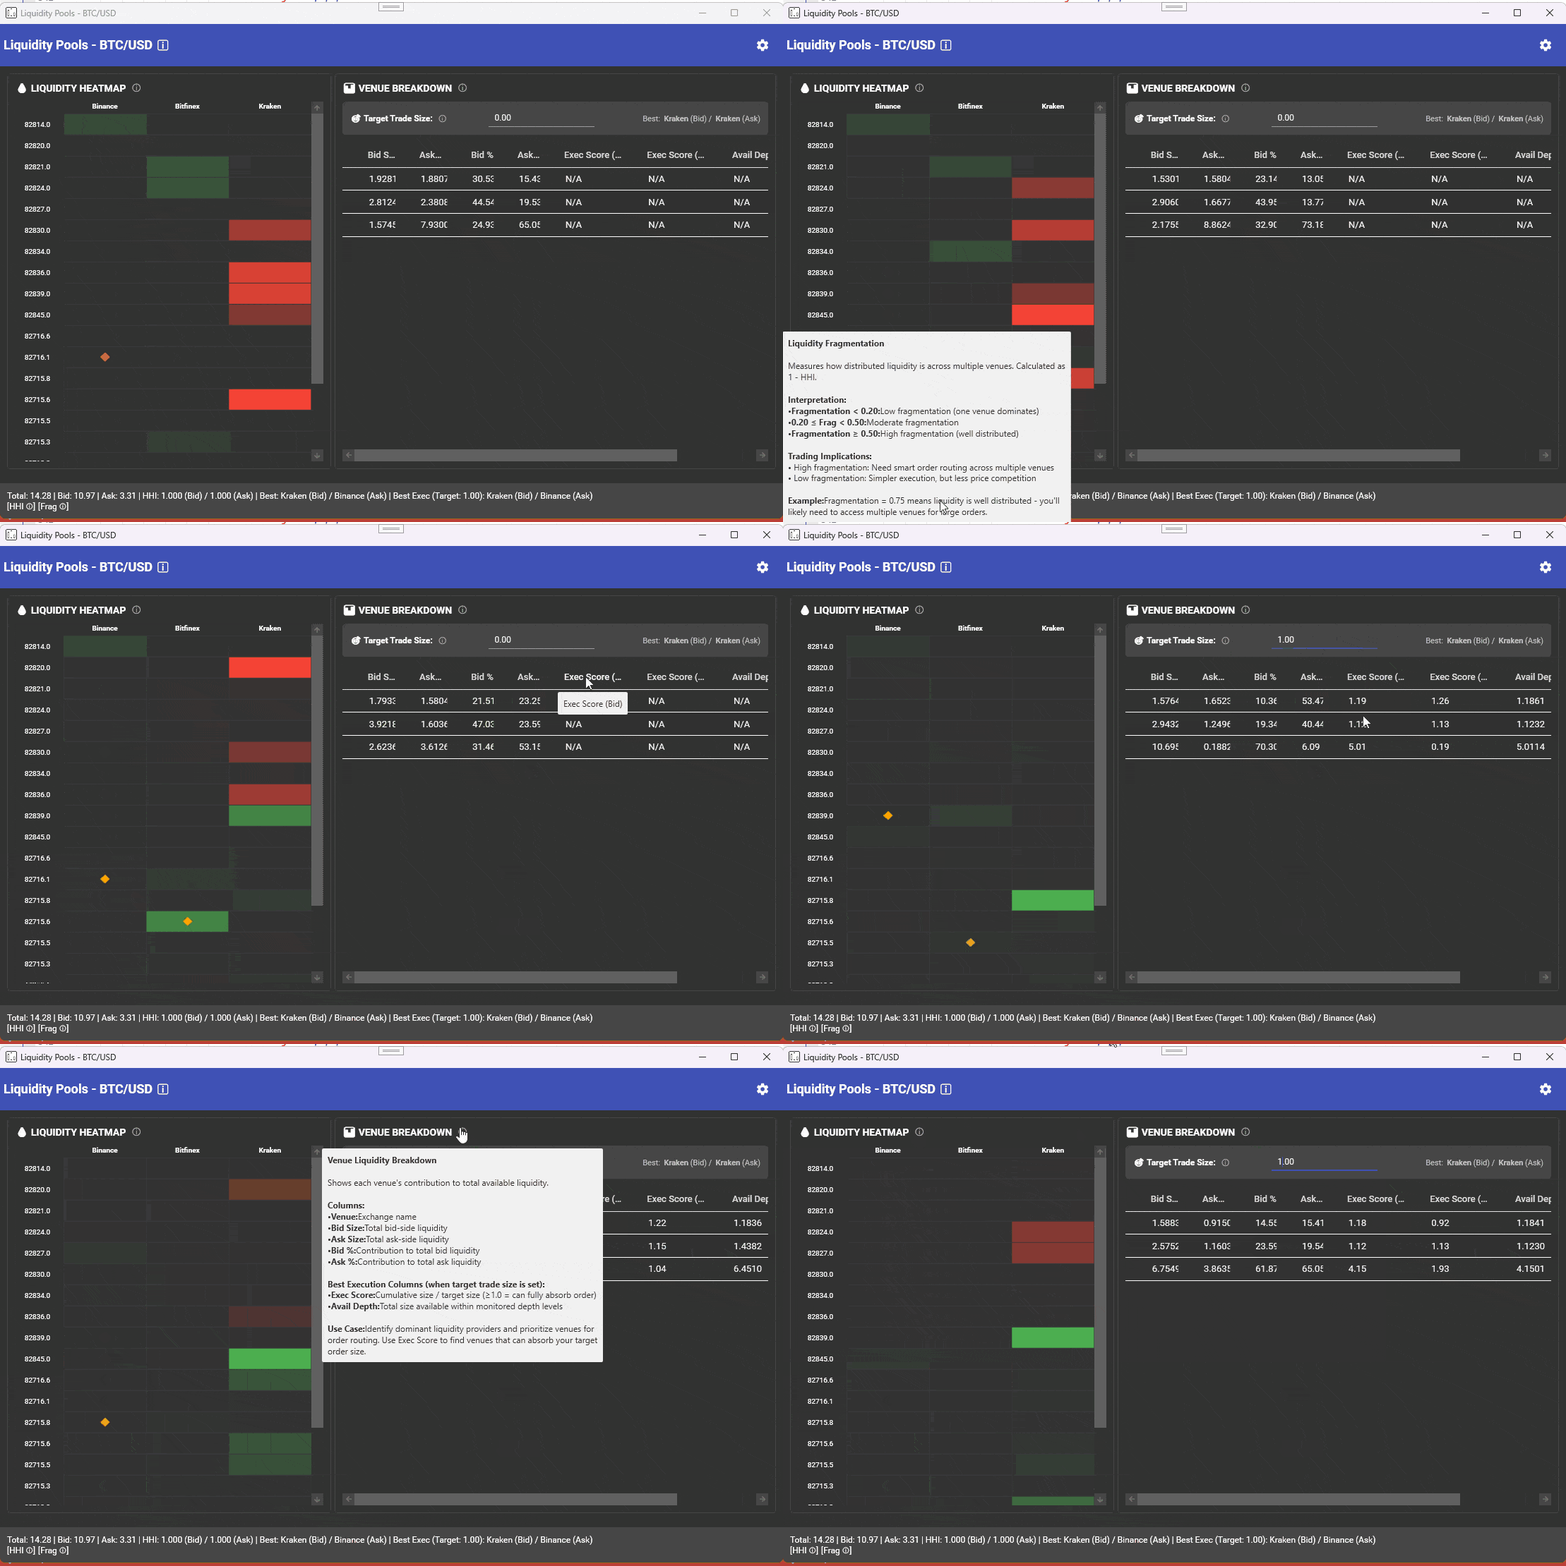
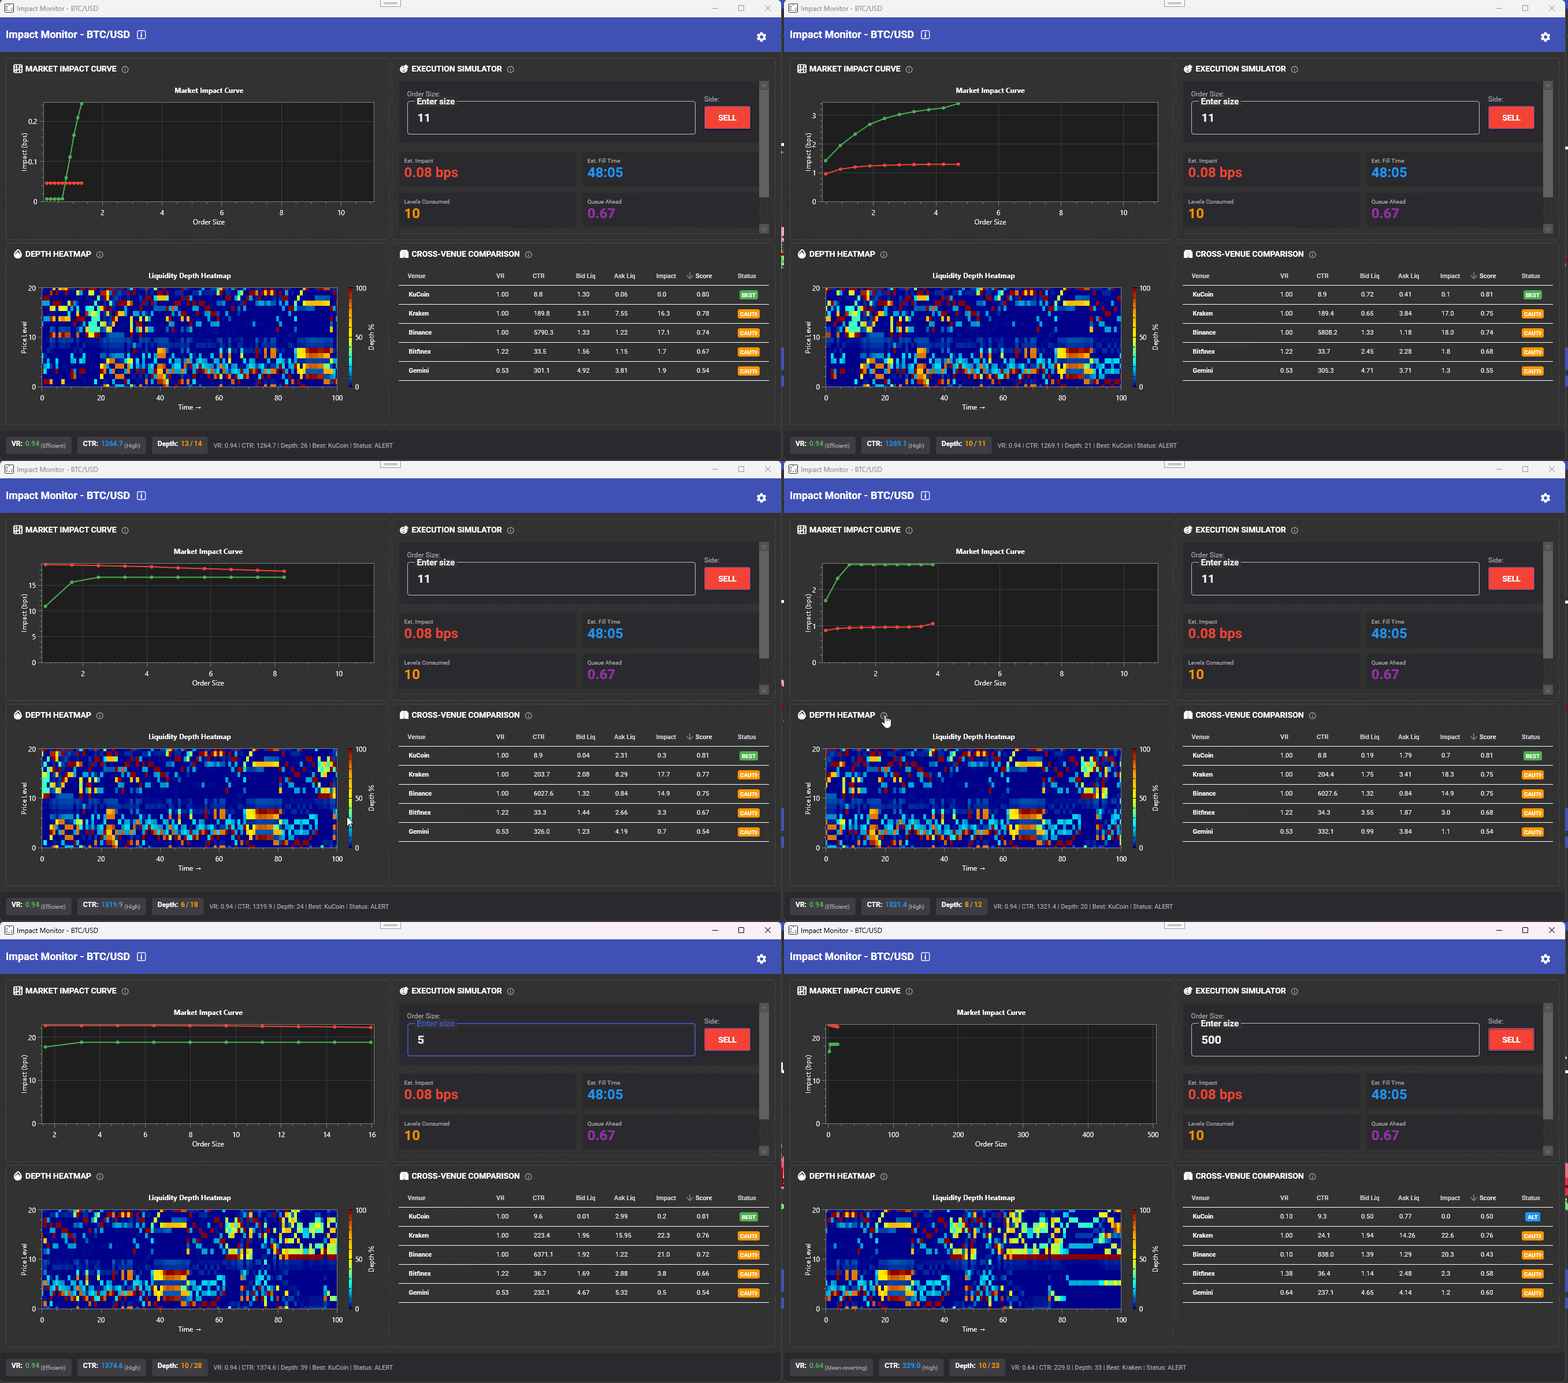
Identify fragmented liquidity, pricing discrepancies, depth changes, and venue-specific behavior from one analytical view.
Feature reference: Real-Time Market Data Pipeline
Monitor feed health, latency, processing performance, and infrastructure behavior alongside market activity.
Feature reference: Microstructure Analytics Foundation
Translate high-volume order-book and trade data into metrics, alerts, and visual evidence that support faster investigation and decision-making.
Feature reference: Extensible Plugin Architecture
Connect proprietary data, create custom studies, and extend the platform without replacing existing trading infrastructure.

Modular extensions for real-time market analytics, built for the speed of electronic trading.

Calculates Limit Order Book Imbalances

Six critical market microstructure ratios

Executed trades vs order book activity

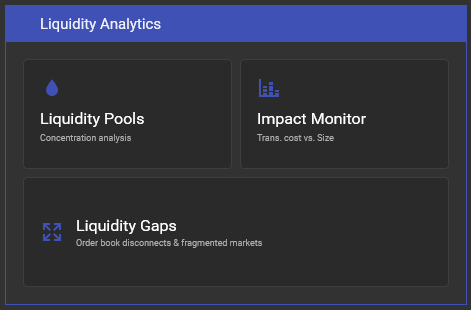
Multi-venue market analysis tools

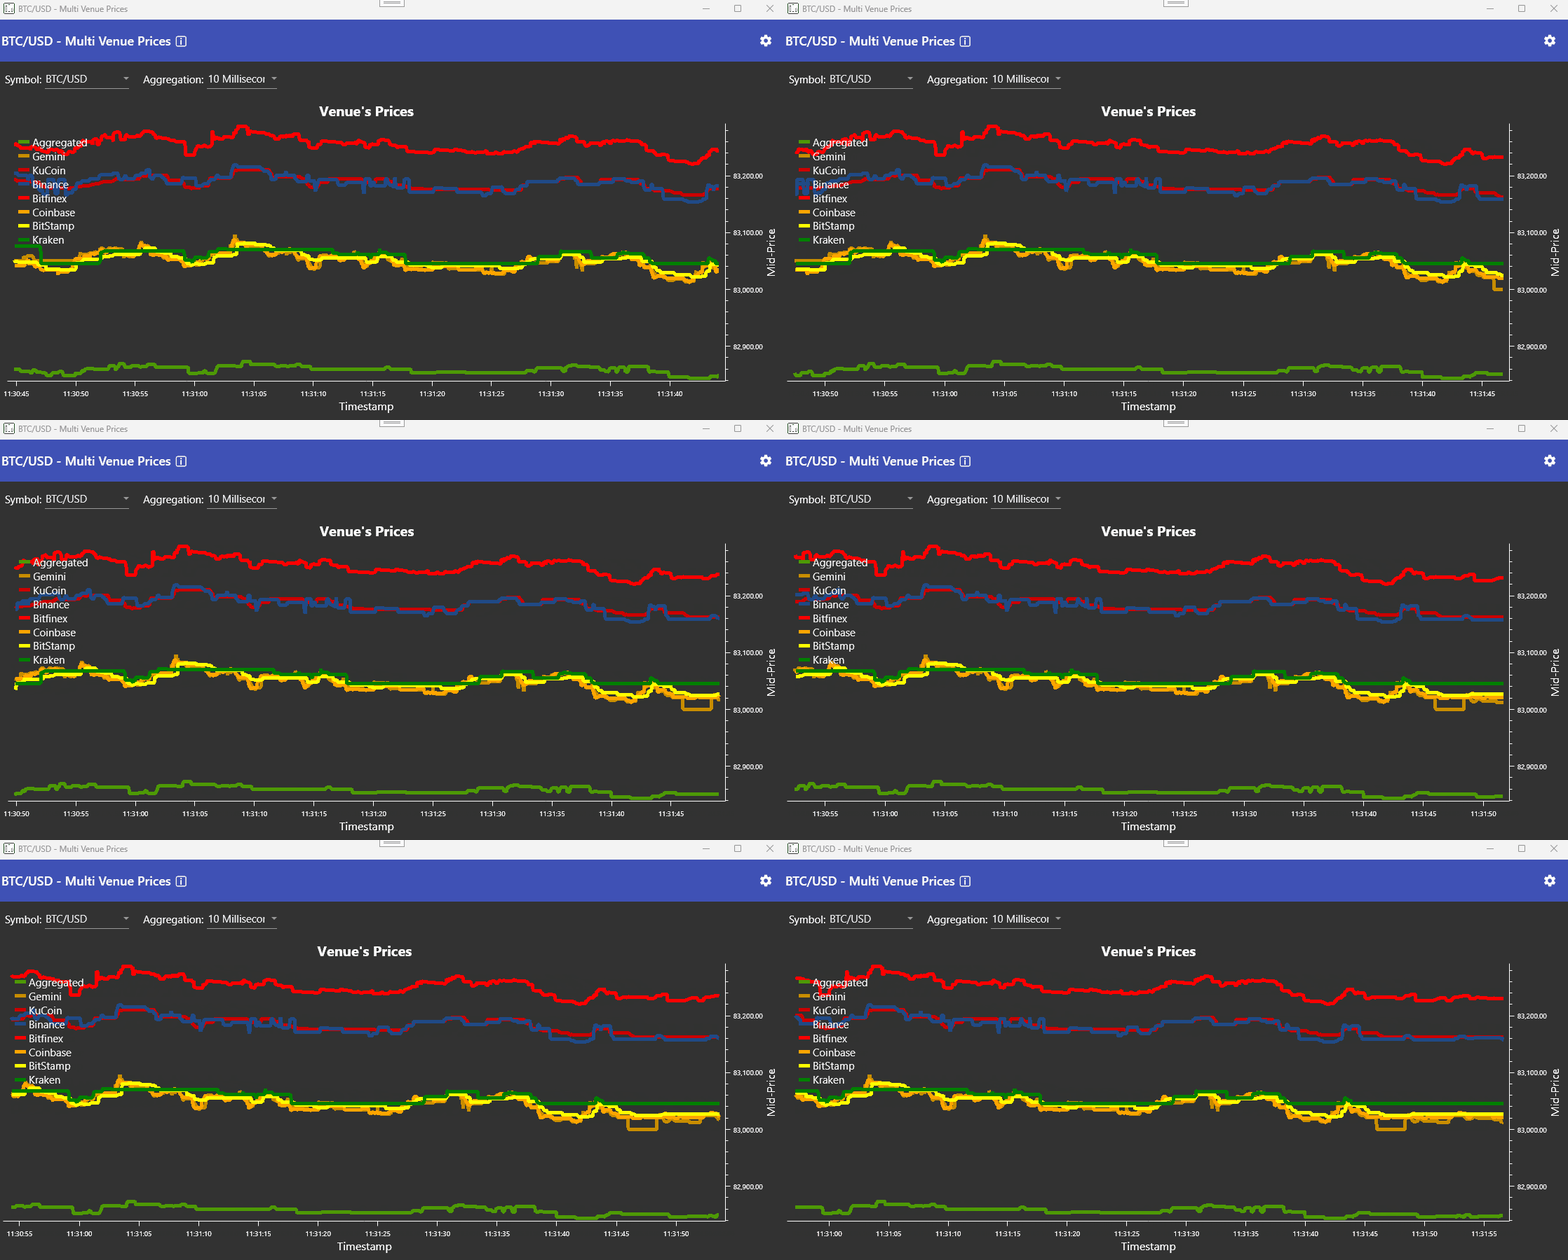
Real-time mid-price chart across all venues

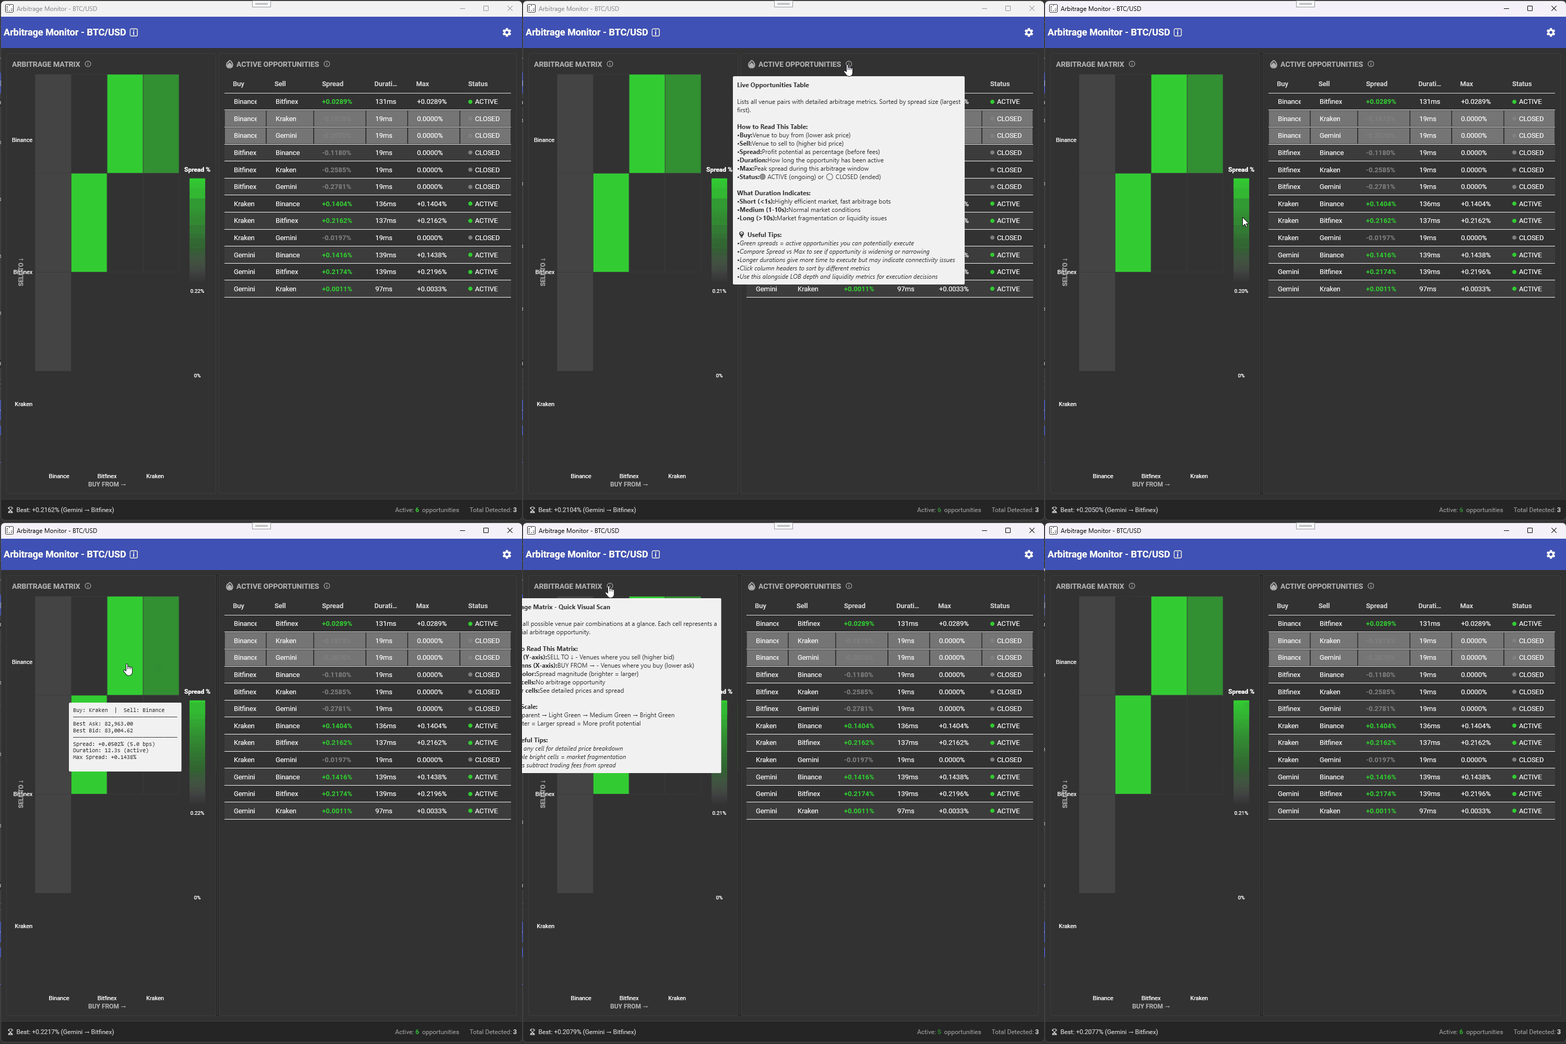
Identifies cross-venue price gaps
From open-source community analytics to PRO L3-ready market microstructure workflows. No hidden fees, no market-data markup.
Free forever
For learners and hobbyists exploring market microstructure.
Request Access+ Community Forum
billed monthly
7-day trial
For quant researchers, systematic traders, and market-structure operators.
Request Access+ Knowledge base + Email
billed monthly
7-day trial
For HFT/prop desks, boutique quant funds, and institutional teams.
Request Access+ Knowledge base + Email + Chat
Custom annual billing and SLA
For firms planning dedicated infrastructure, institutional controls, and custom commercial terms.
Contact Us+ Dedicated account manager + custom SLA
From private beta to global institutional scale: the product path behind VisualHFT.
Q3 2026
The commercial platform opens to an invitation-based group of early users. VisualHFT delivers real-time, tick-by-tick processing of raw non-aggregated market data, GPU-accelerated visualization, direct multi-venue connectivity, trigger-driven alerts, session record and replay, and the Plugin Marketplace from day one.
Q4 2026 - Q1 2027
The marketplace scales with a growing plugin roadmap, the open-source community expands into a true ecosystem, and L3 order-by-order depth unlocks a more granular view of the book where venue data supports it. Because the platform is market-agnostic by design, coverage expands into equities, futures, and derivatives.
2027
Intelligence moves deeper into the engine itself, with AI capabilities developed from VisualHFT's codebase and market microstructure data rather than added as a wrapper. Market access matures across venues and asset classes, academic partners publish research through the platform, and the product deepens across risk management, surveillance, research, and infrastructure monitoring.
Beyond
VisualHFT expands toward institutional deployment: enterprise-grade scalability, centralized management, SSO, compliance tooling, private marketplaces, custom data feeds, execution cost analytics, and deeper exchange and data-vendor partnerships. AI evolves toward predictive market intelligence at institutional scale.
Want to shape the roadmap? Join our beta and give direct feedback.
Request AccessVisualHFT combines a native desktop runtime, normalized market-data ingestion, high-throughput processing, GPU-aware visualization, and an SDK-first plugin system for quantitative market microstructure workflows.
A Windows desktop application built for live monitoring, low-latency interaction, and local analytics.
Live venue streams are normalized into a consistent order-book and trade pipeline for analytics.
Designed for fine-grained market updates, raw depth inspection, and future order-by-order workflows.
Dense order-book and time-series views use accelerated rendering paths with fallback behavior.
Teams can extend VisualHFT with their own connectors, studies, dashboards, and internal tools.
Market data and exchange credentials stay local; online services support licensing and entitlements.
Engineering deep dives, product updates, and trading research.
Collaborate with traders, developers, and quants building the future of algorithmic trading.
Discussion boards for Q&A, strategy sharing, and community support.
Join our partner program. Contribute code or research and earn rewards.