Inside the VisualHFT Private Beta: From Market Data to Execution Decisions
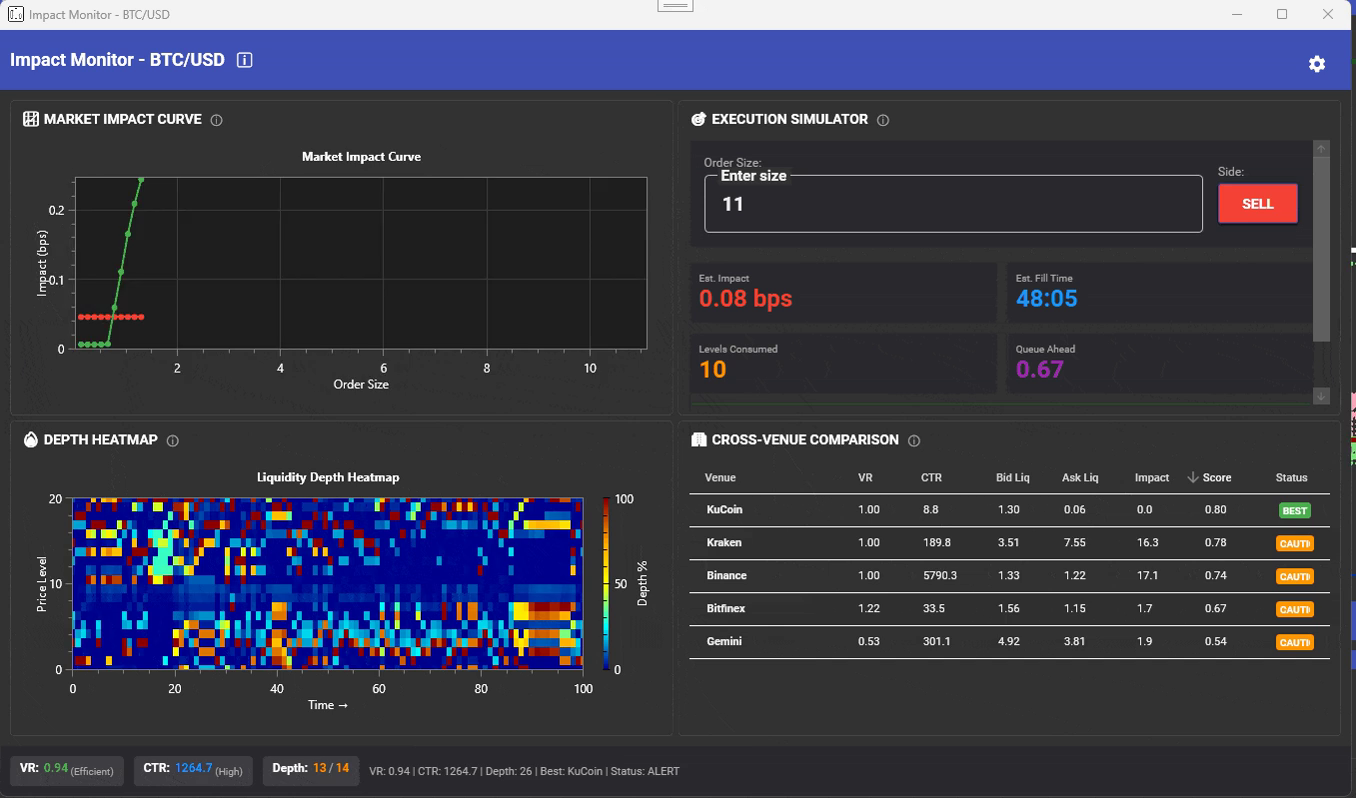
VisualHFT’s private beta is now open by invitation. We are inviting early users to evaluate the commercial platform against real trading workflows: their venues, instruments, market-data inputs, execution questions, and post-trade investigations.
The announcement is only the entry point. The product is broader than a collection of market-data screens. VisualHFT connects live order books and trades to the decisions that surround an order: whether to execute, where available depth fits the intended size, whether the data feeding the decision is trustworthy, what changed during the event, and why the resulting fill performed as it did.
This article follows that workflow from end to end. It starts with the product foundation, then examines the featured capabilities through the outcomes they support.
The Product as One Decision Pipeline
VisualHFT is a native Windows platform for market-microstructure analysis. Connected venue feeds enter a normalized order-book and trade pipeline. Studies and plugins interpret those updates. Decision surfaces expose the current liquidity, flow, venue, and infrastructure conditions. Triggered capture, replay, and diagnostics preserve the evidence needed to investigate an event after it happens.
The same architecture supports live monitoring, pre-trade analysis, post-trade investigation, and custom extensions.
The pipeline follows six linked stages:
- Market input. Ingest raw, non-aggregated order-book and trade updates from connected feeds. Outcome: preserve the market detail needed for microstructure analysis.
- Normalization. Map venue-specific data into consistent books, trades, symbols, precision, and timestamps. Outcome: compare venues and run shared analytics without rewriting every study.
- Live interpretation. Apply studies, ratios, triggers, and visual analytics as conditions change. Outcome: turn market activity into evidence that can support a decision.
- Decision workflow. Connect pre-trade cost, liquidity, venue, feed, and flow context. Outcome: choose size, venue, timing, and execution posture with current evidence.
- Investigation. Capture event windows, replay them, and evaluate execution quality. Outcome: reproduce what happened and explain the result.
- Extension. Load connectors, studies, and tools through the plugin architecture and Marketplace. Outcome: adapt the platform to proprietary data and internal workflows.
The launch set connects Binance, Bitstamp, Coinbase, Bitfinex, Kraken, Gemini, and KuCoin at Level 2. Those feeds provide the initial live context for the workflows below.
Plan Before Execution
The first useful outcome happens before an order reaches the market. The question is whether the expected edge can survive the liquidity currently available.
Liquidity Analytics: three views of the same execution decision
The featured Liquidity Analytics workspace brings together Impact Monitor, Liquidity Pools, and Liquidity Gaps. Each view examines a different part of the same problem:
- Impact Monitor estimates what a proposed order may consume.
- Liquidity Pools shows where depth is concentrated across venues and prices.
- Liquidity Gaps exposes structural weaknesses that can turn size into a discontinuous price move.
The outcome is a pre-trade decision supported by visible evidence: execute now, reduce the order, split it differently, wait for depth to recover, or use another venue.
Impact Monitor: will the order cost more than the expected edge?
Impact Monitor is the raw product view used as the hero of this article. It combines four pieces of evidence in one workflow: a market-impact curve, an execution simulator, a depth heatmap, and cross-venue comparison.
The execution simulator reports estimated impact, estimated fill time, consumed levels, and queue context for the proposed size. The venue comparison adds the current liquidity conditions on connected exchanges. This makes the relationship between order size and available depth explicit before the order is committed.
The decision follows directly from the evidence. If the estimated impact consumes the expected edge, the operator can reduce size or wait. If another venue shows deeper usable liquidity, routing can change. If the estimated fill time is incompatible with the strategy, the order can become more aggressive or be divided into smaller slices.
Liquidity Pools: where does the intended size fit?
Liquidity is distributed across price levels and venues. A top-of-book quote cannot show whether enough depth exists behind the best price or whether that depth is concentrated in one place.
Liquidity Pools visualizes depth concentration with a venue-by-price heatmap. It also exposes concentration and fragmentation context so the operator can compare where the intended size fits with less expected impact.
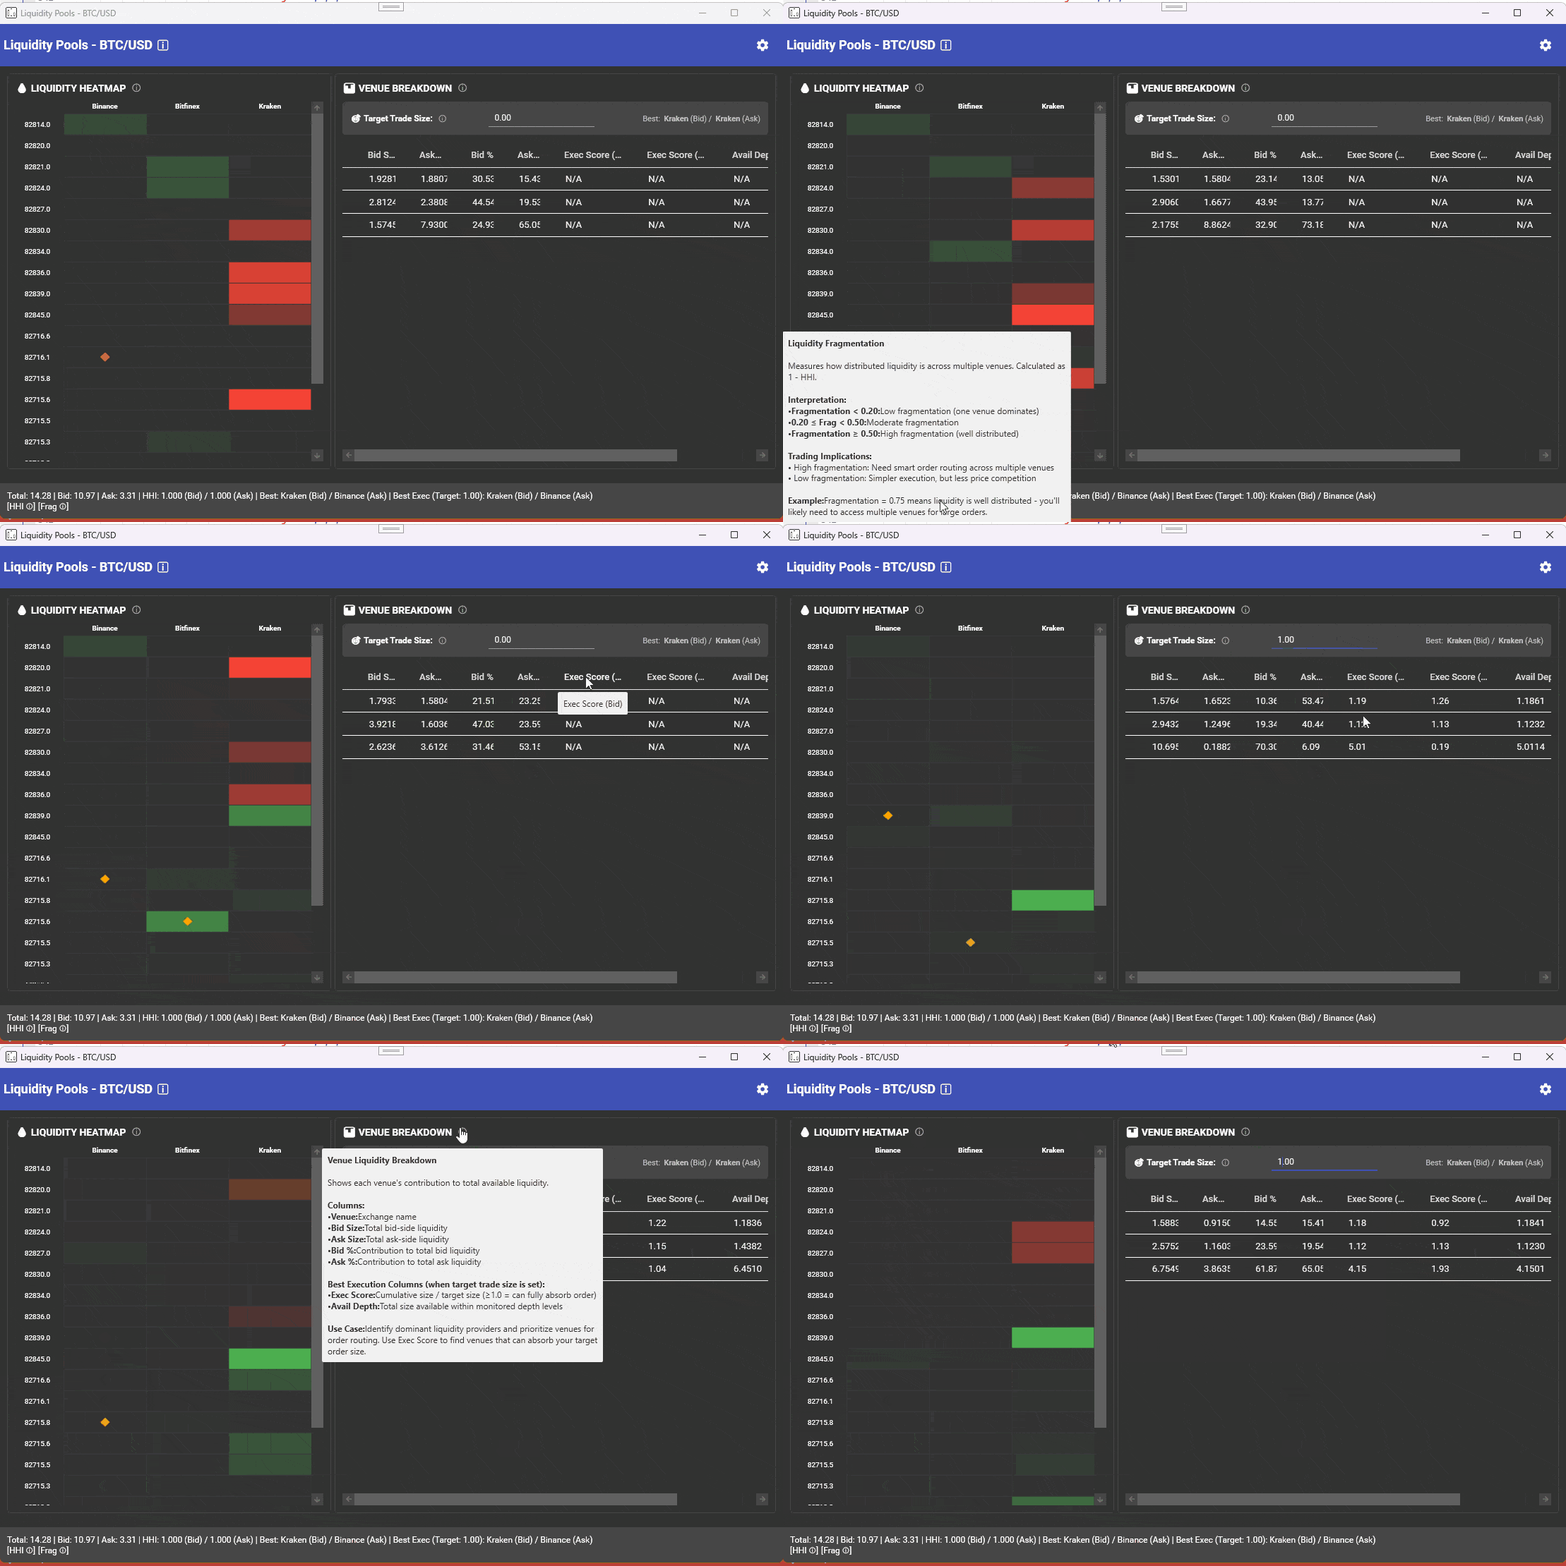
The raw Liquidity Pools view. The outcome is a venue and slice-size decision grounded in visible depth rather than the best quote alone.
Liquidity Gaps: where could the book jump instead of absorb?
A book can look healthy at its first level while remaining fragile immediately behind it. Liquidity Gaps identifies thin regions, abrupt depth cliffs, their severity, and how long they persist.
Persistent gaps change the meaning of a market order or an aggressive limit order. Size that appears reasonable at the touch may cross a weak section of the book and move through several levels. Seeing that structure beforehand supports a different decision: avoid the venue, reduce the order, stage the execution, or wait for the book to rebuild.
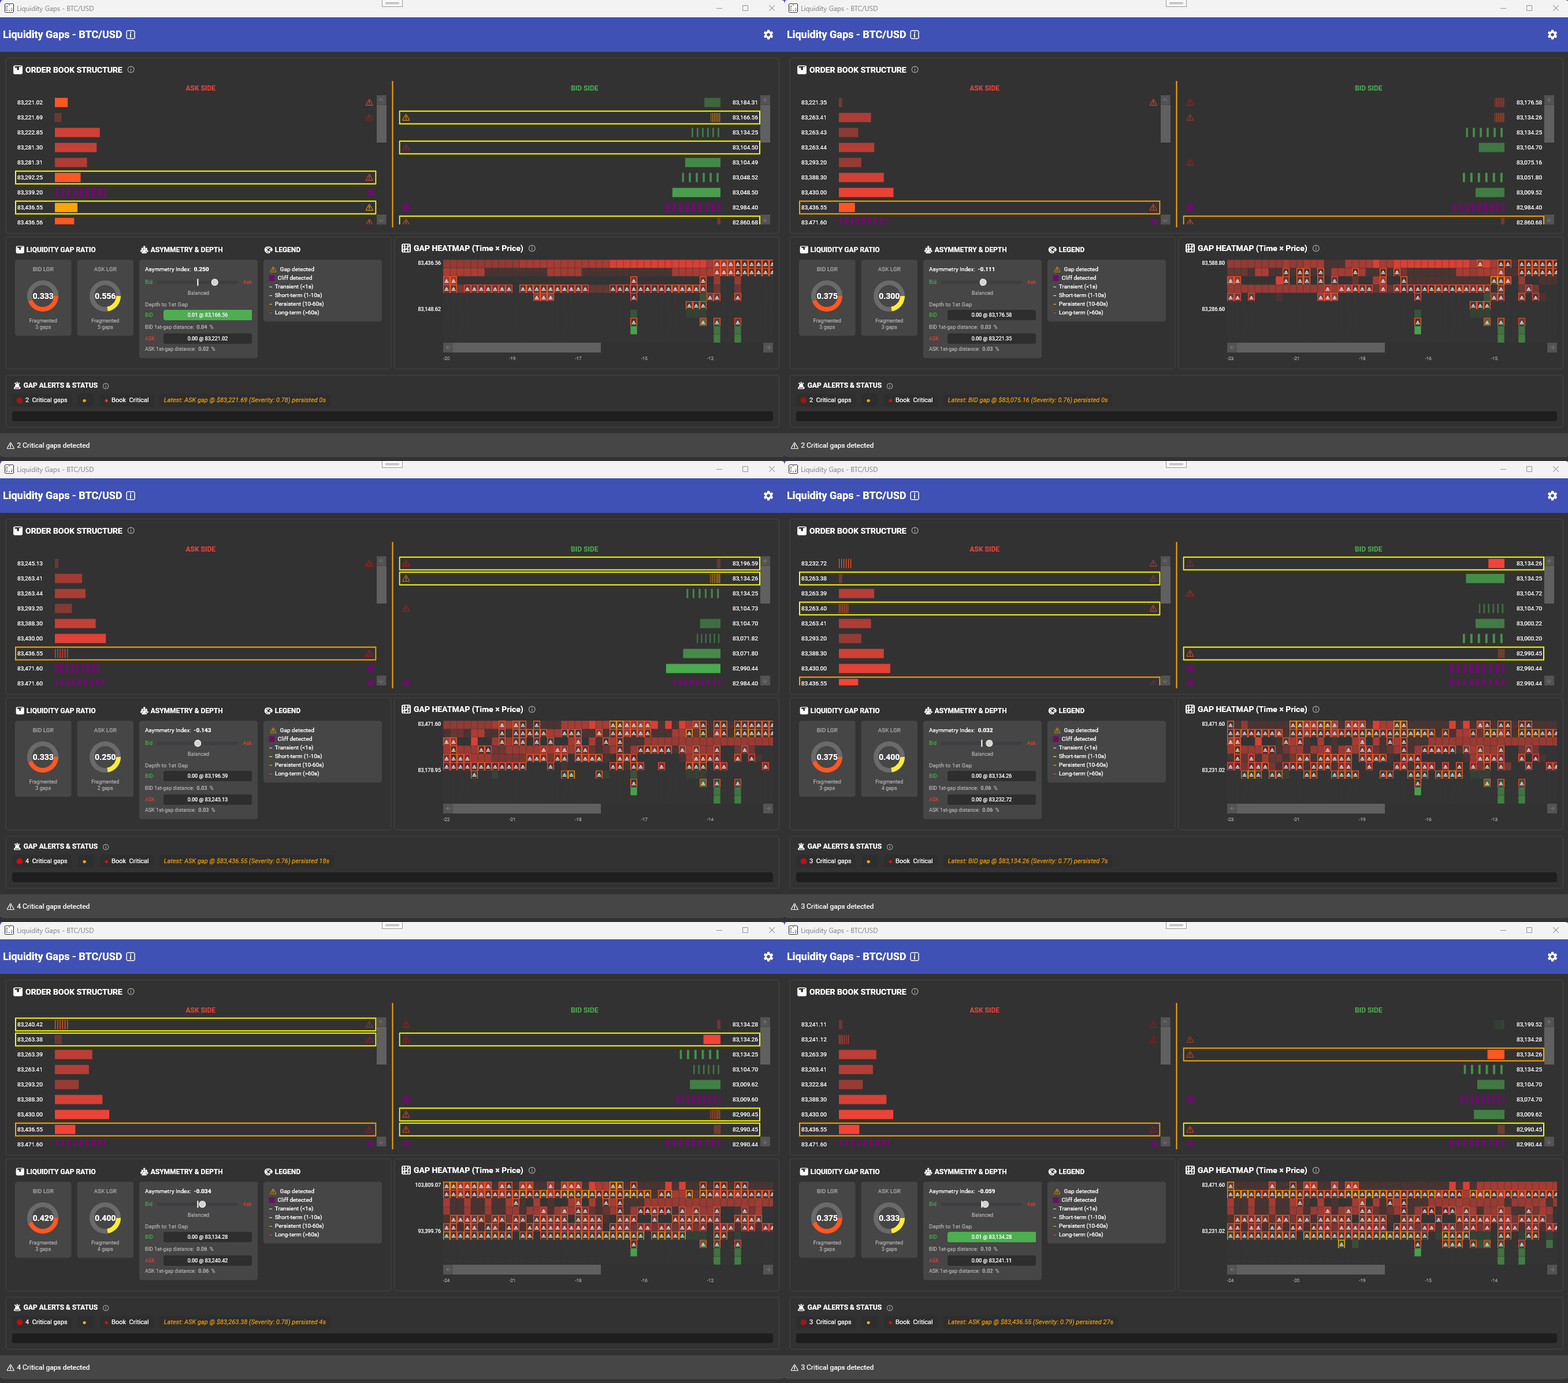
Liquidity Gaps makes structural weakness visible before the order tests it.
See the Market Between Venues
Price discovery does not occur on one screen. Connected venues can disagree in price, available depth, update cadence, and recovery behavior. VisualHFT keeps those differences visible as part of the execution context.
Multi-Venue Prices: see where the market is leading or lagging
The featured Multi-Venue Prices view places venue mid-prices for the same symbol on one time-aligned chart. Its value comes from making divergence, convergence, and venue-specific movement visible as they develop.
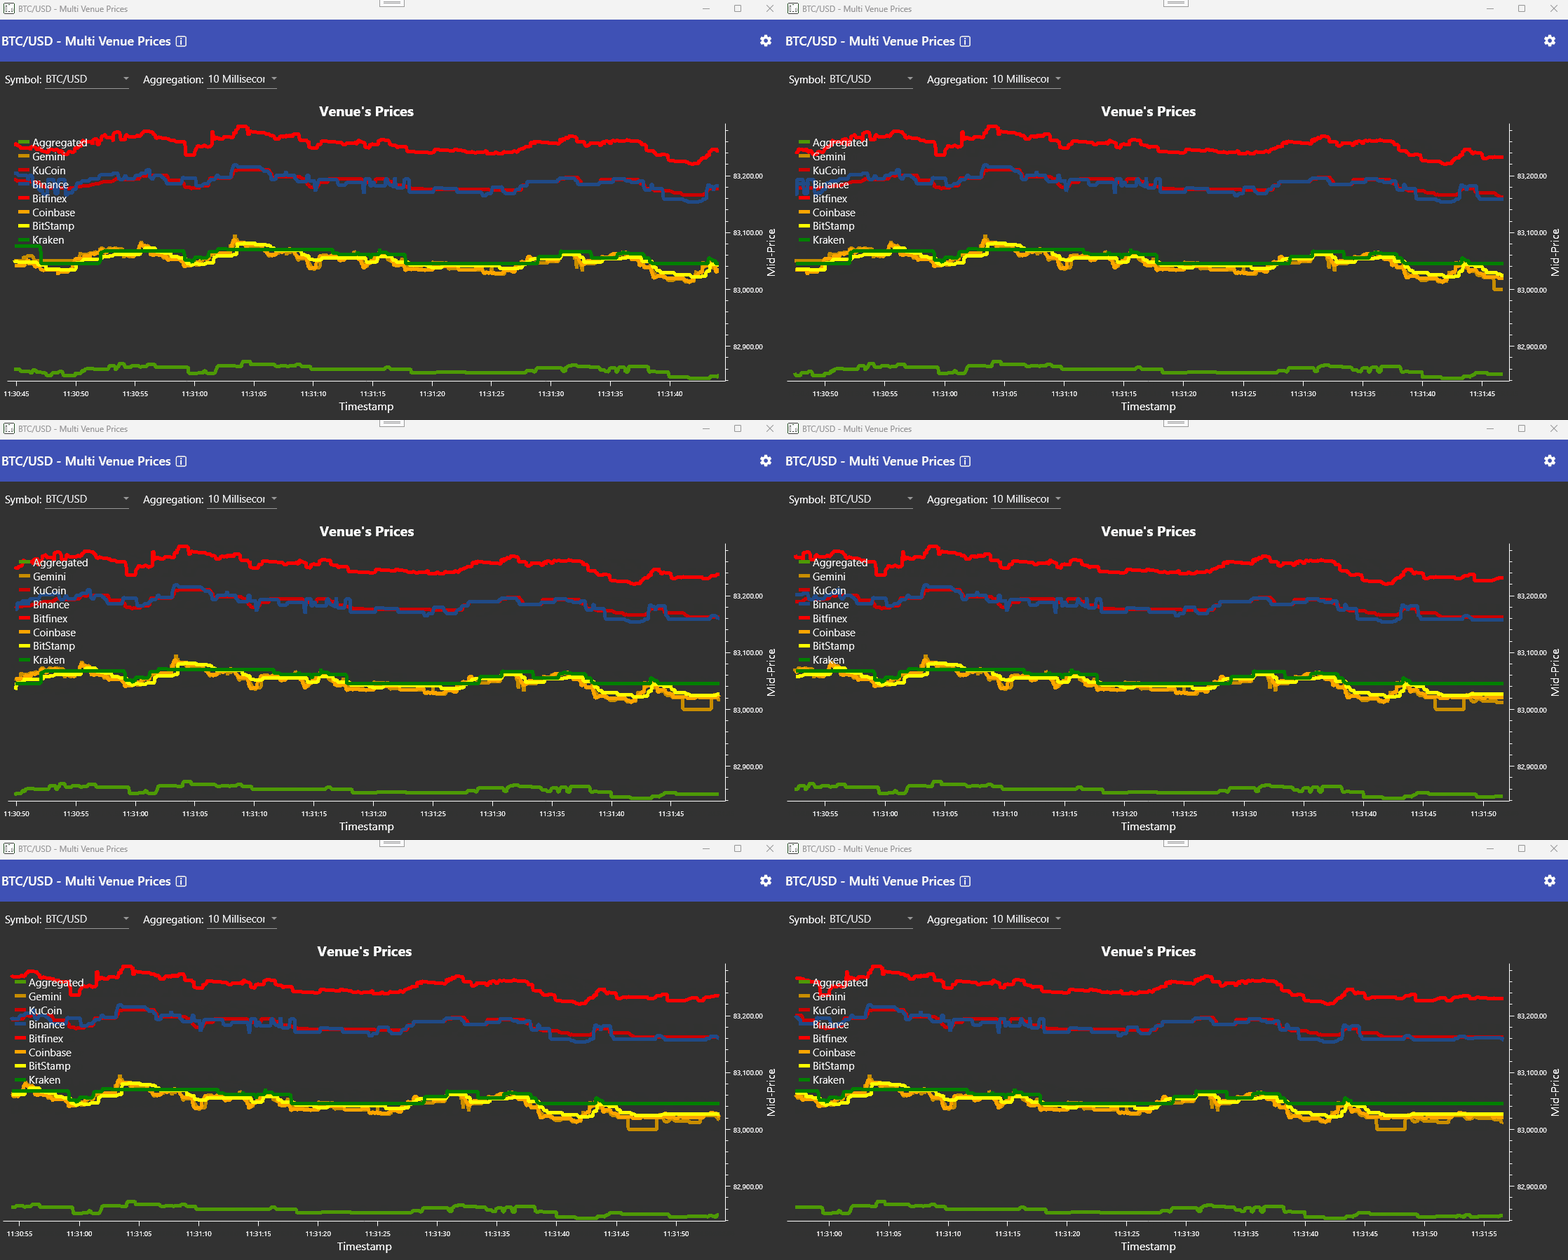
A shared timeline makes venue dislocations and convergence visible without switching between separate market windows.
Arbitrage Monitoring: measure fragmentation while it exists
Arbitrage Monitoring turns cross-venue discrepancies into a matrix and a live opportunity table. The raw view shows the buy venue, sell venue, spread, duration, maximum observed spread, and current status for each venue pair.
That duration matters. A visible price gap that survives for milliseconds has a different operational meaning from one that persists. The view supports two outcomes: act on a live discrepancy when the workflow and venue access allow it, or investigate the connectivity and price-discovery path that created the gap.
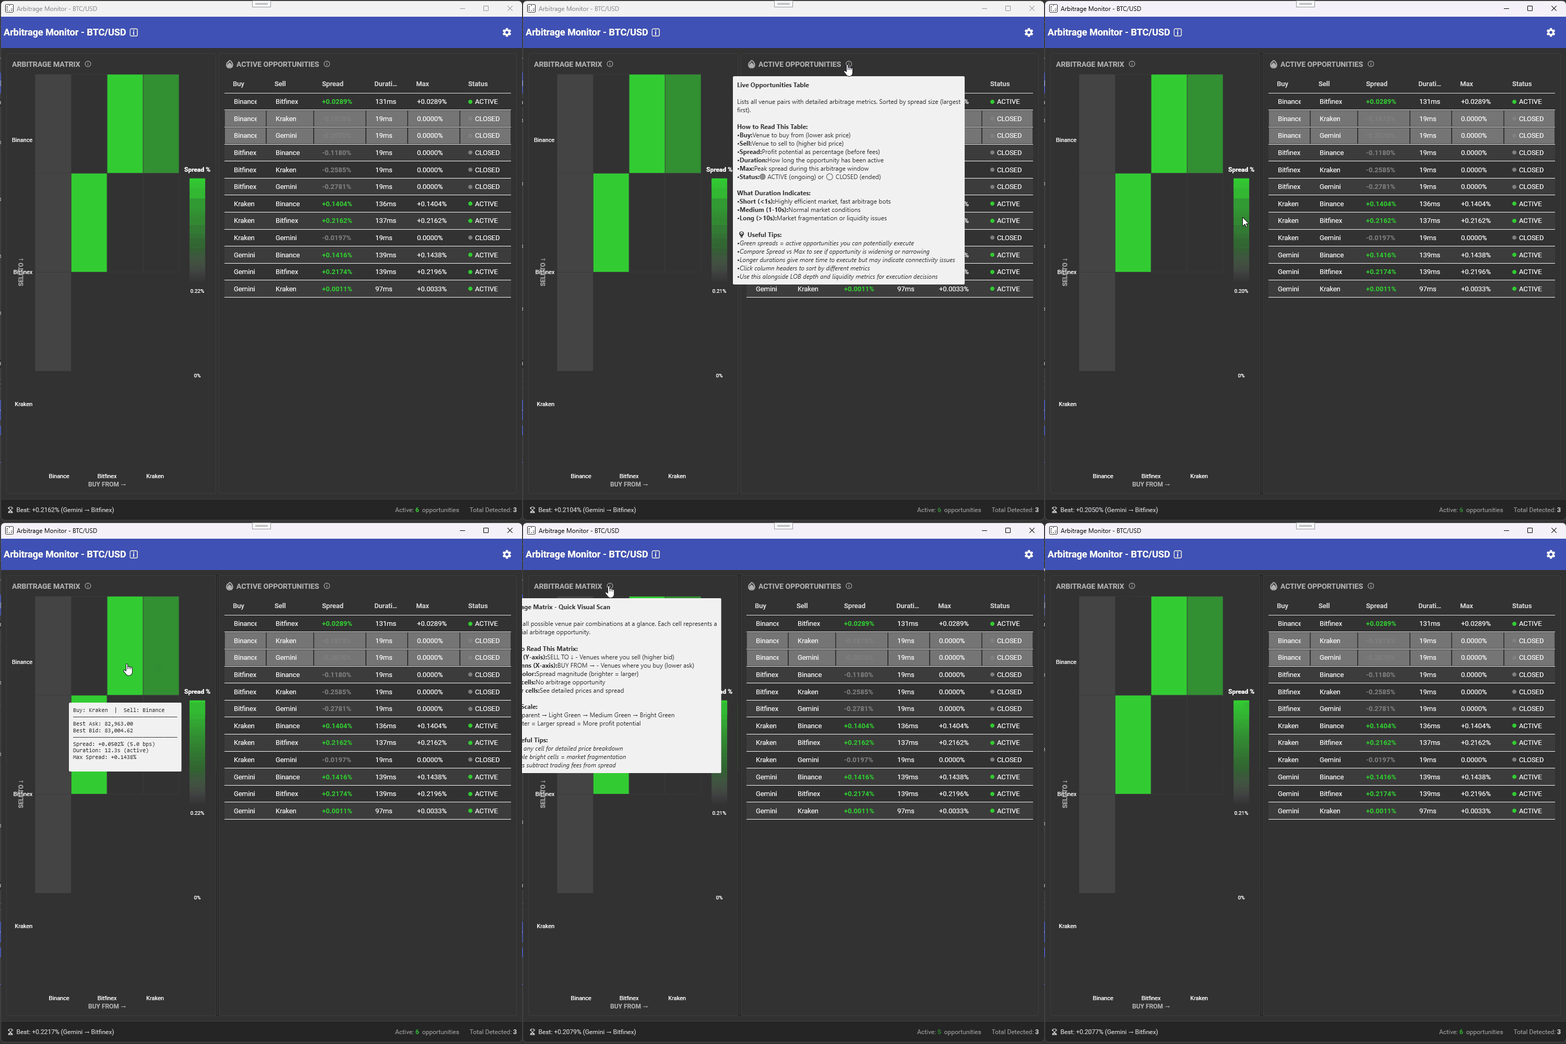
The product view keeps the venue pair, magnitude, duration, and lifecycle of each discrepancy together.
Feed health: verify the input before trusting the output
Every downstream metric depends on the market-data feed that produced it. Data Feeds Monitoring tracks message and trade rates, bursts, silent gaps, operational errors, and connection state for each configured provider and symbol.
The outcome is operational protection. When a feed degrades, the operator can investigate, fail over, or suspend a dependent workflow before stale or incomplete input distorts an execution decision.
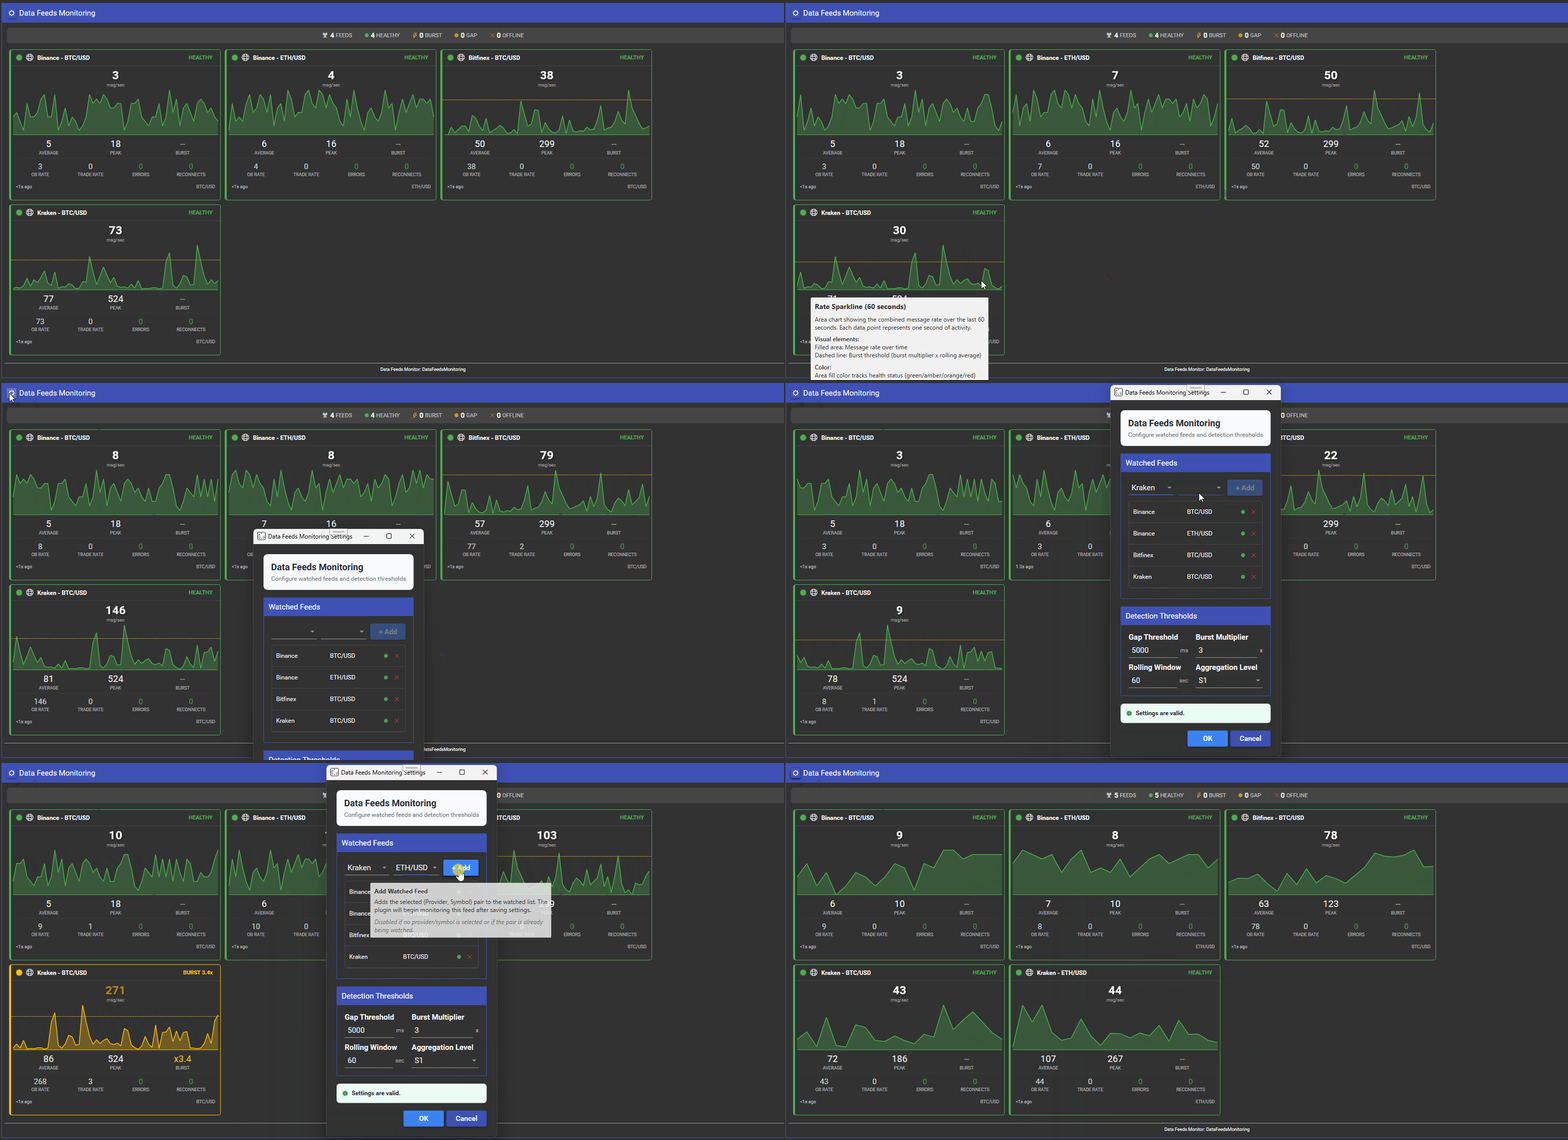
Market insight is only as reliable as the input. Feed health stays in the same operational context as market activity.
Read the Conditions Behind the Price
The visible price is the result of activity inside the book. VisualHFT studies expose the liquidity and flow conditions developing around that result.
Market Resilience: is the book recovering after impact?
Market Resilience measures the response after a large trade through time, spread, and depth recovery. A book that replenishes quickly presents a different execution environment from one that remains wide and thin after the same initial shock.
The outcome is a change in execution posture. An operator can wait for recovery, reduce aggressiveness, or continue when spread and depth have returned to acceptable conditions.
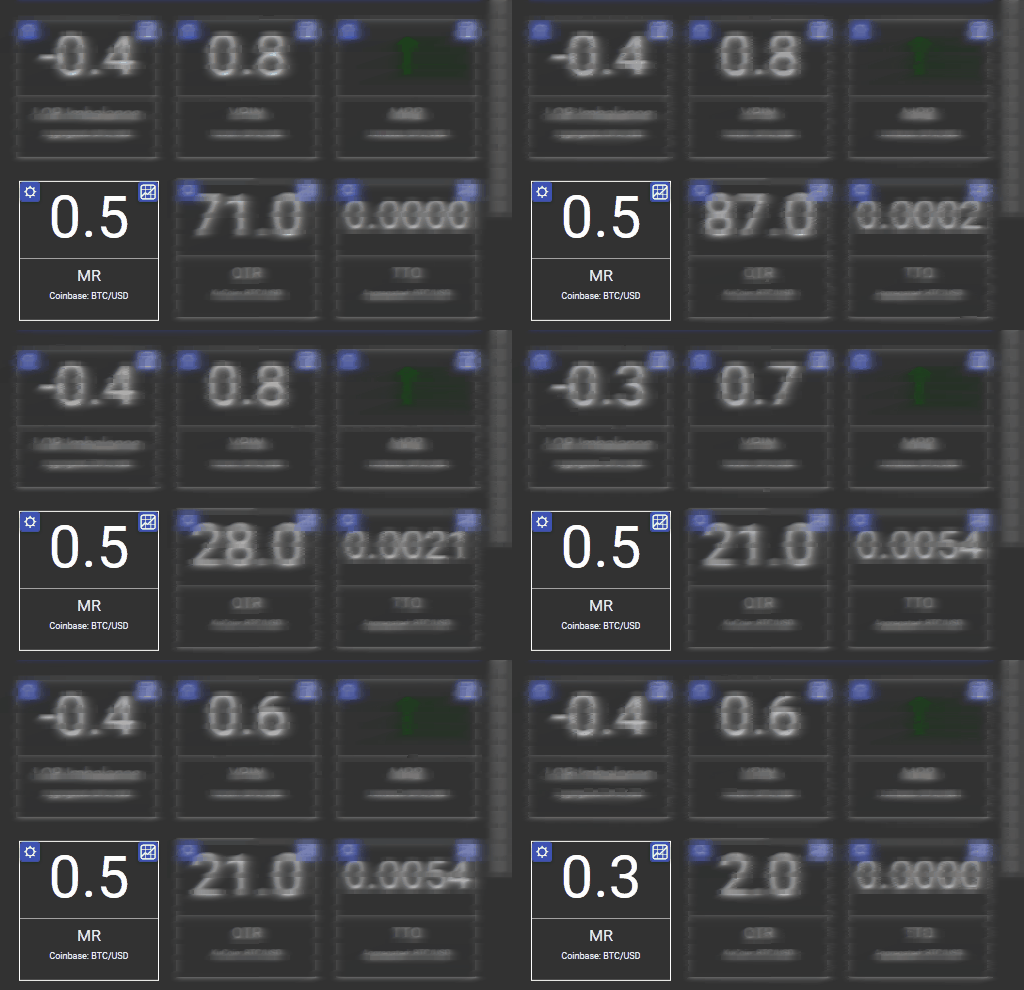
Recovery speed adds context that the initial trade and price move cannot provide alone.
VPIN: is order flow becoming one-sided?
The VPIN study organizes buy and sell volume into volume-synchronized buckets and reports the imbalance on a normalized scale. It should be used as a condition monitor and does not guarantee the direction of the next price move.
The practical outcome is participation control. Sustained one-sided flow can prompt the operator to reduce passive exposure, reconsider timing, or inspect the book and resilience measures before increasing participation.
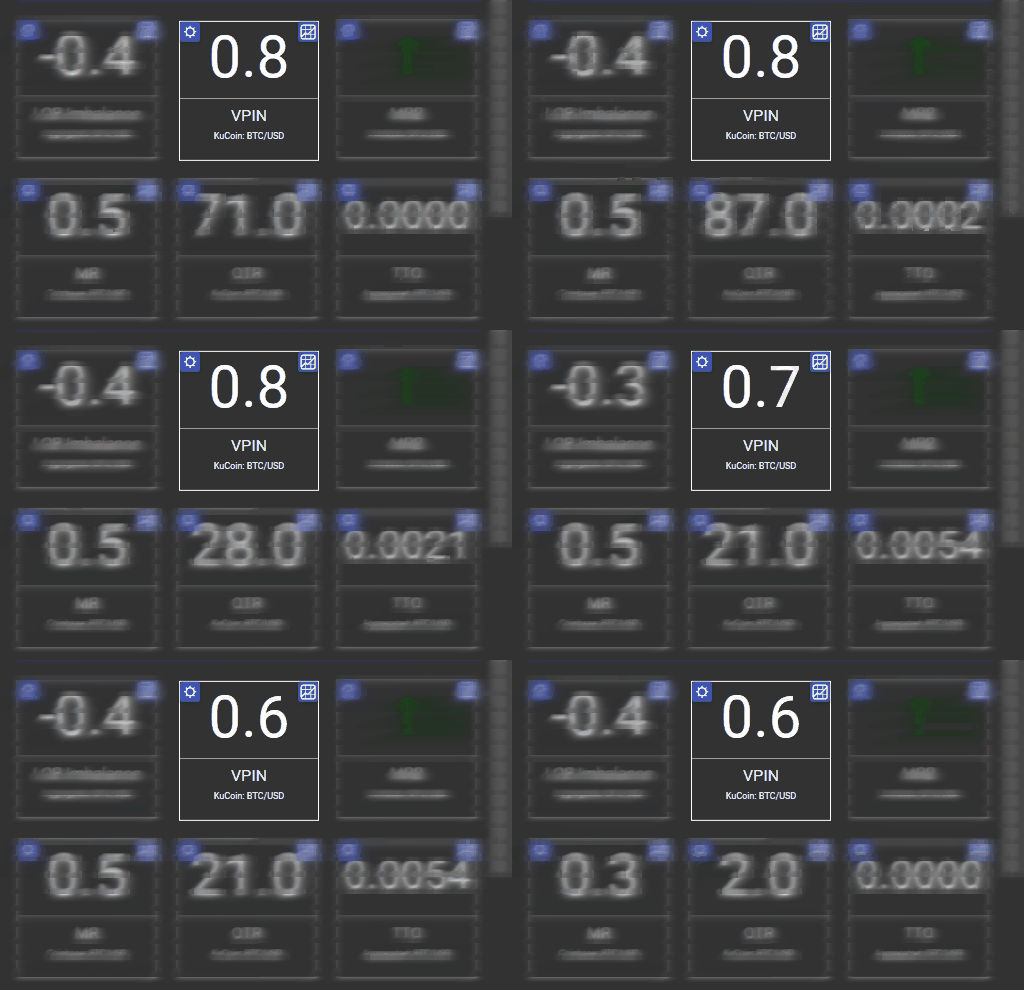
The study exposes changing flow composition while the execution decision is still active.
Preserve the Event, Then Replay the Same Market
Live monitoring explains the current moment. Investigation requires the exact sequence that led into and out of it.
Event Capture Recorder: preserve the seconds that matter
Event Capture Recorder continuously buffers selected live streams. When a TriggerEngine rule fires, it writes a compact window containing the market history before the trigger and the events that follow it.
This changes the investigation workflow. The operator starts with the relevant event window instead of searching an entire session or reconstructing the incident from disconnected logs. The captured file is already prepared for Replay Engine.
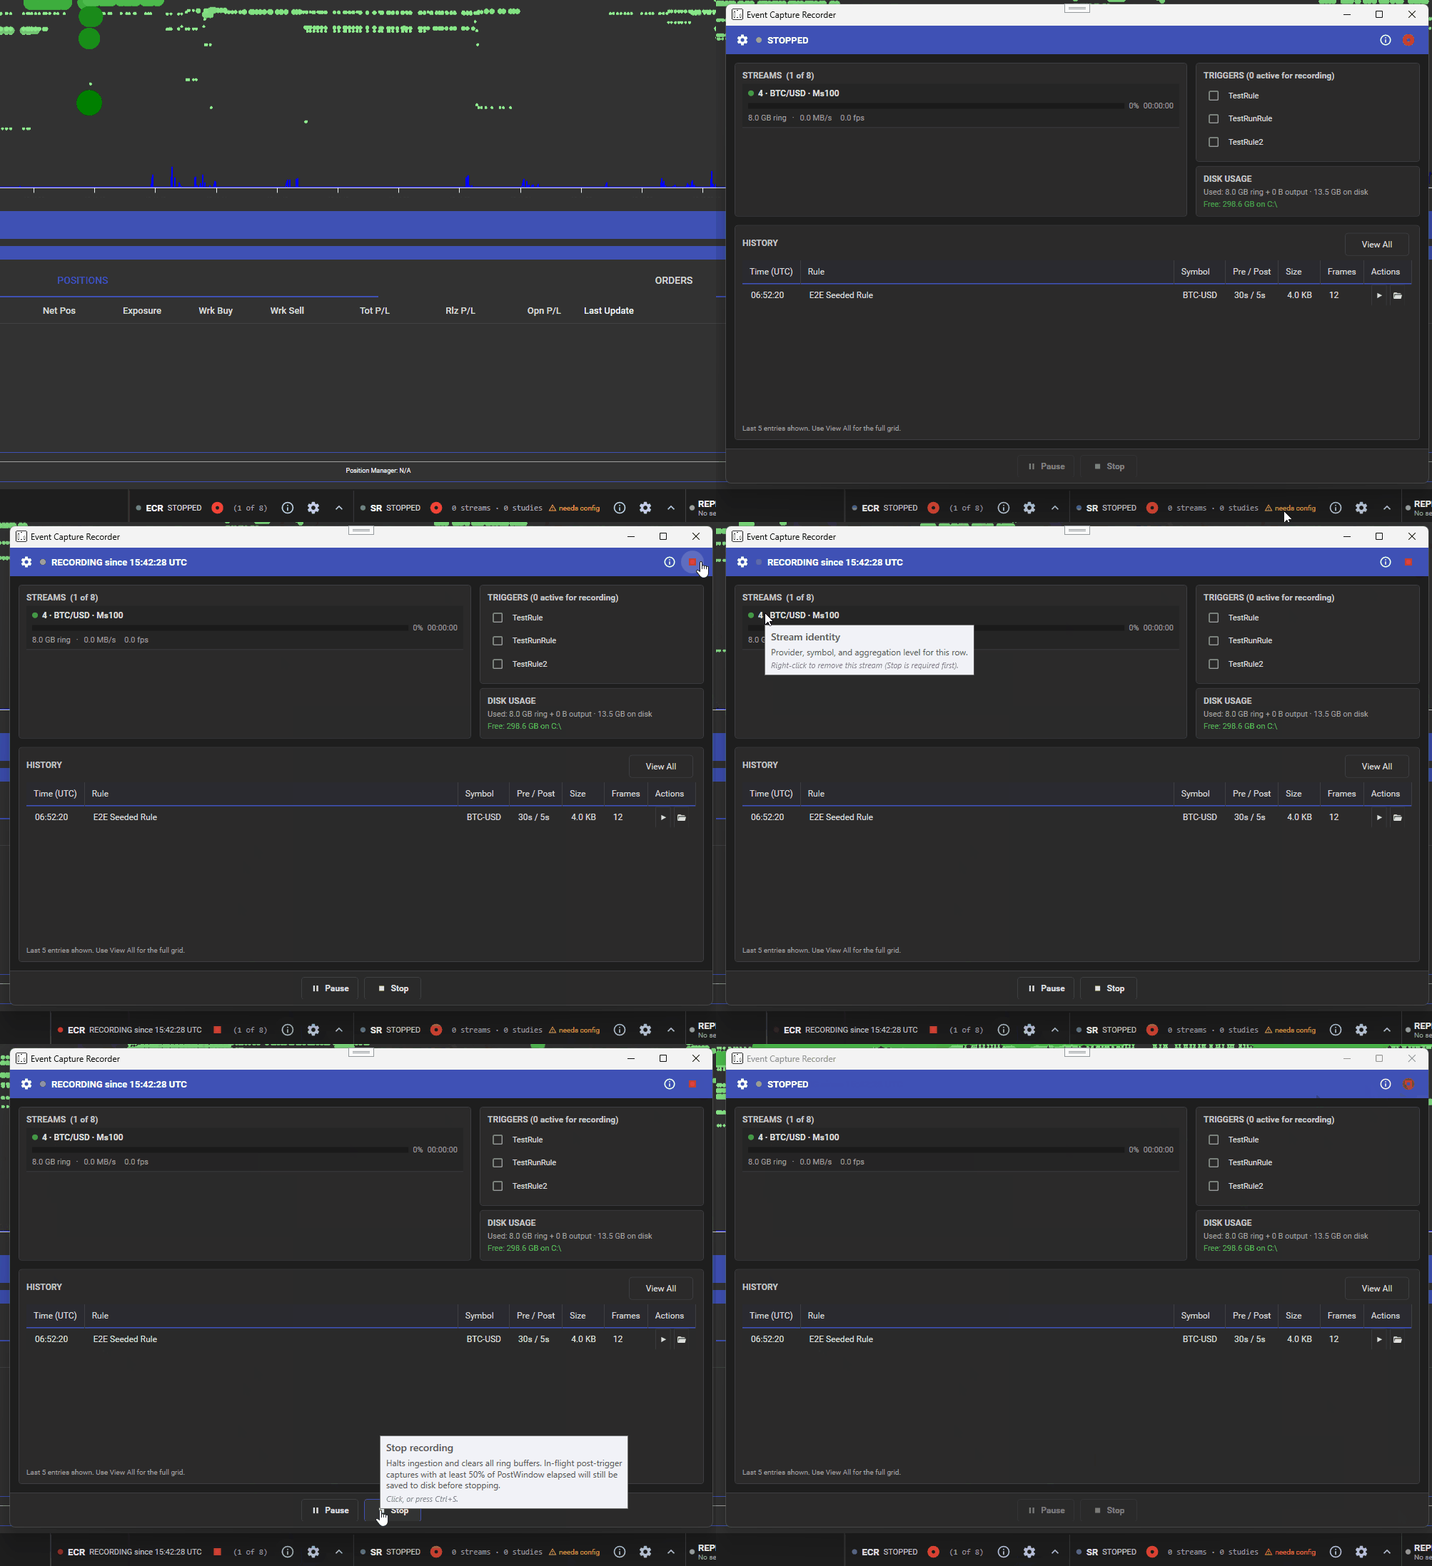
Trigger-aligned capture preserves the market context surrounding a condition, alert, or incident.
Replay Engine: run captured data through the live analysis path
Replay Engine publishes recorded order books, trades, and execution reports back through the same pipelines used by live feeds. Existing studies and charts run against the replay without requiring separate analytical implementations.
Playback uses a virtual clock and provides play, pause, stop, restart, speed, and bookmark controls. The operator can reproduce the event, slow down the critical interval, move between bookmarks, and examine how every dependent study responded to the same sequence.
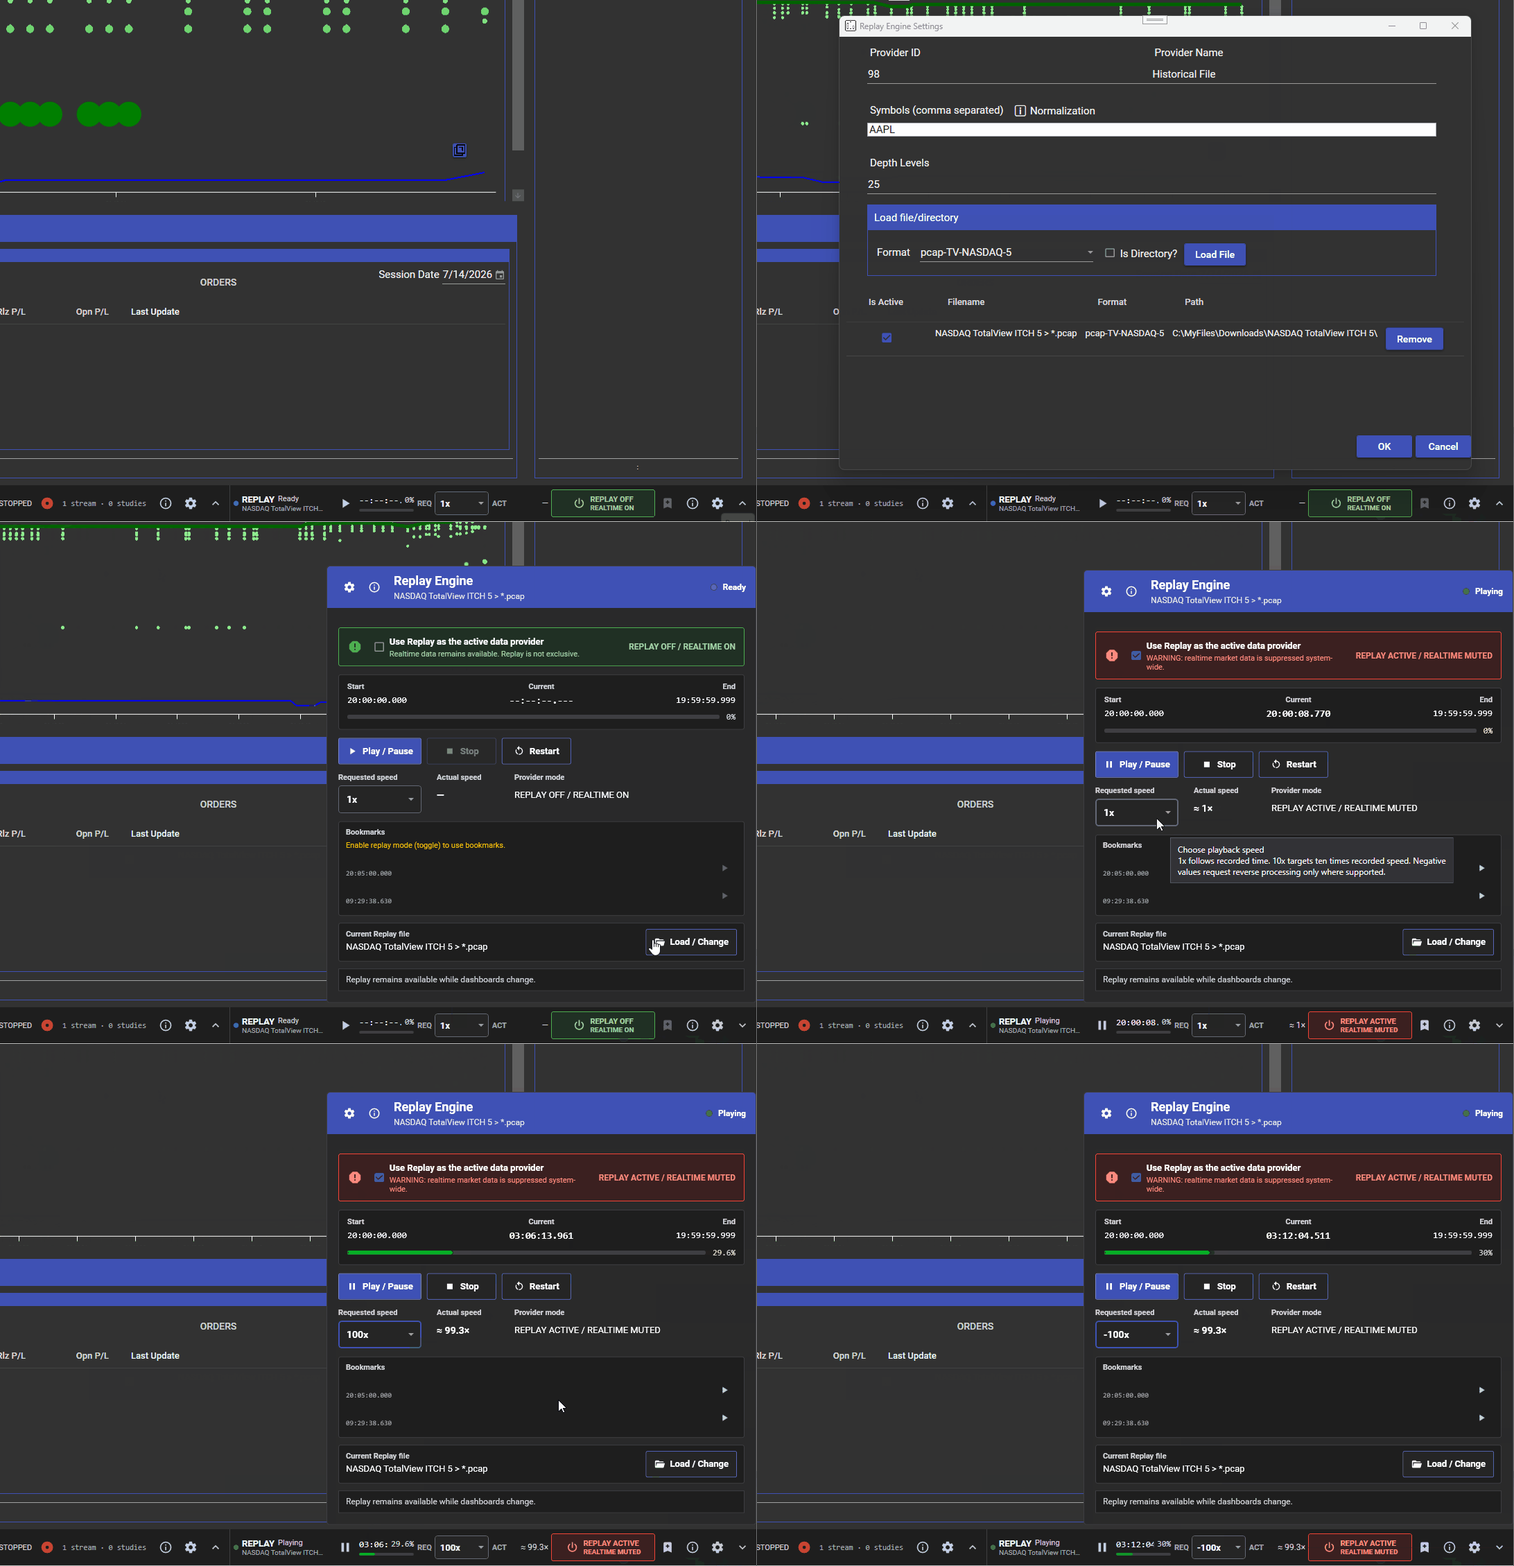
The outcome is repeatable investigation: the same captured market can be examined through the same analytical pipeline.
Explain the Fill With Market Context
Execution quality is rarely explained by one number. Slippage may reflect liquidity, queue position, venue behavior, adverse selection, latency, order placement, or several of those conditions at once.
Microstructure Diagnostics: why did this fill underperform?
The featured Microstructure Diagnostics workflow replays execution records against captured order-book and trade data. It evaluates each fill in the market that prevailed rather than treating the execution report as an isolated record.
The diagnostic output covers:
- Slippage and implementation shortfall against decision and arrival prices
- Fill rate and queue-position context for passive orders
- Post-fill markouts and adverse-selection evidence
- Maker and taker economics, fees, rebates, and break-even spread
- Latency breakdown and the potential value of faster execution
- Missed-fill and cancel-replace costs
- Venue comparison by fill quality, slippage, reject behavior, and reliability
Companion studies such as VPIN, LOB Imbalance, Market Resilience, and Market Ratios enrich the analysis with the conditions surrounding each fill. The outcome is a concrete change supported by evidence: adjust routing, placement, timing, size, venue selection, or infrastructure.
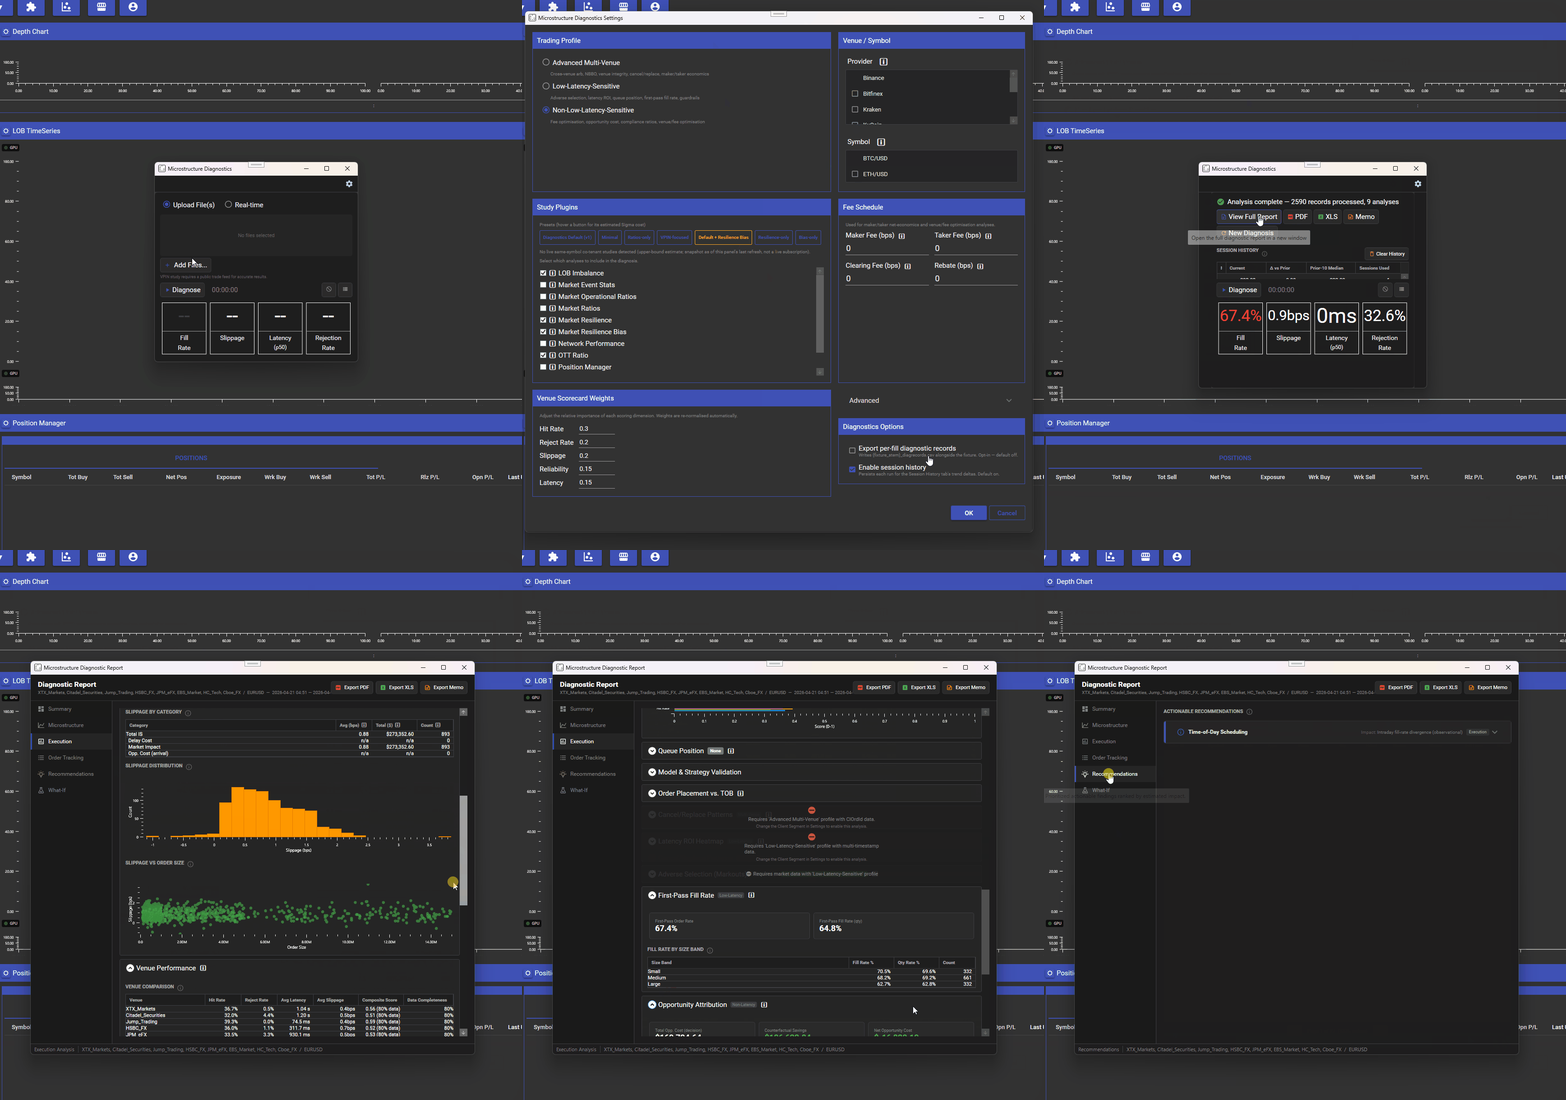
The diagnostic report connects execution performance to the book, flow, venue, and latency conditions that existed at the time.
Extend the Product Around Your Workflow
VisualHFT’s plugin architecture keeps the market-data pipeline, studies, connectors, and user-facing tools separable. Teams can connect proprietary data, create internal studies, and add workflow-specific tools without replacing the rest of the platform.
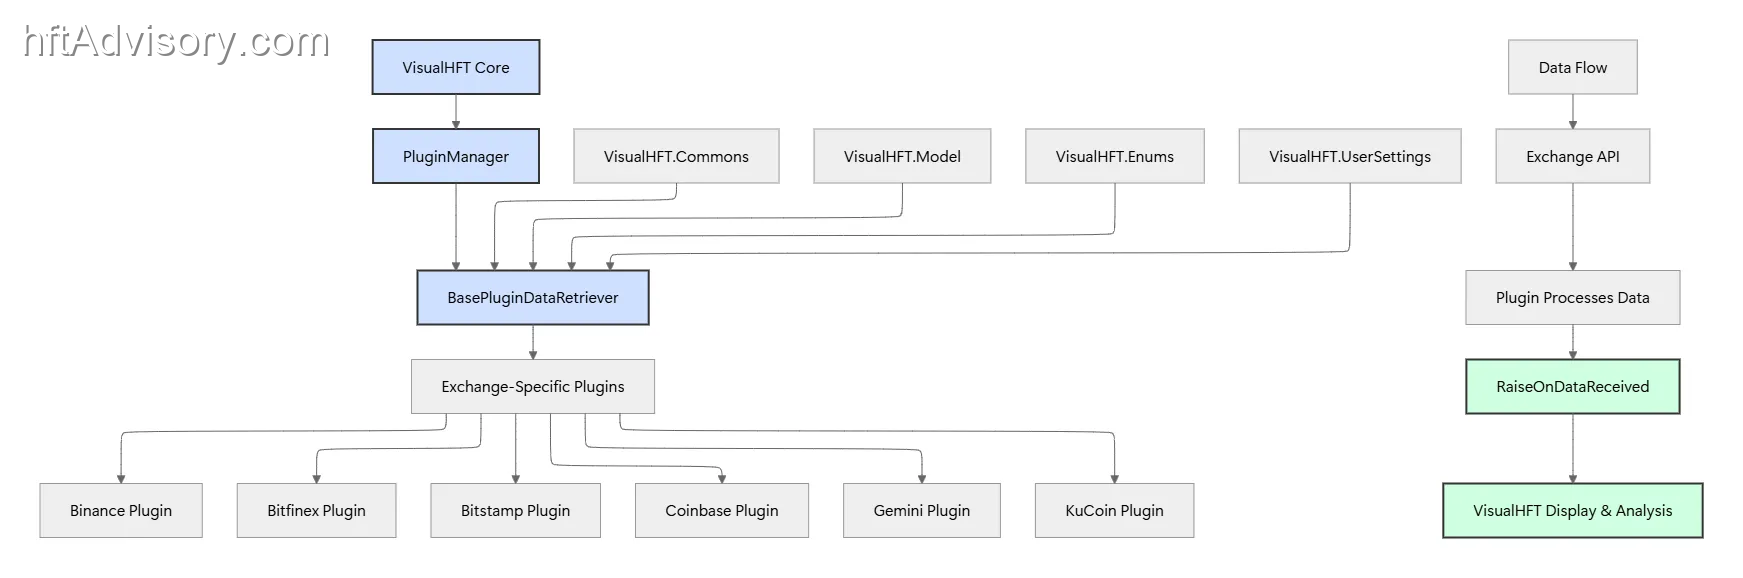
The Plugin Marketplace provides the delivery path for those extensions. As of July 22, 2026, the live public Marketplace catalog returned 29 entries marked Ready and zero entries marked Coming Soon. That catalog, backed by the live database, is the availability authority used for this article.
The initial live connector set is crypto Level 2. Futures and equities remain on the product roadmap. The architecture already supports custom connectors and proprietary feeds when a team needs to bring its own market-data path.
The Open-Source Core Remains a Separate Path
VisualHFT’s open-source core has been public since 2019 under Apache-2.0. It remains available for core analytics, public connectors, study plugins, and community extensibility. The commercial private beta adds a path for teams evaluating the broader product and Marketplace workflows while the public repository remains independently usable.
That separation is intentional. A developer interested only in the code does not need private-beta access. A trading team evaluating the commercial workflow can use the same open foundation while testing the extended product against its own requirements.
How to Evaluate the Private Beta
A productive beta evaluation should start with a real workflow rather than a tour of screens.
- Bring an order-size or venue-selection question and test it through Impact Monitor and Liquidity Analytics.
- Compare the same symbol across connected venues and examine price, depth, and feed-health differences.
- Define a trigger around a market or infrastructure condition and capture the surrounding event window.
- Replay that event through the studies used during live monitoring.
- Load execution records into Microstructure Diagnostics and connect the resulting fill quality to the market that prevailed.
- Identify where proprietary data, a custom connector, or an internal study would need to enter the pipeline.
The evaluation succeeds when the workflow produces evidence that changes or confirms a decision.
Three Ways to Participate
Request private-beta access. Evaluate the commercial platform against your own market-data and execution workflows through the VisualHFT access request.
Join the VisualHFT community. Use the Discord channels for technical discussion, product feedback, support, and bug reports.
Use or contribute to the open-source core. Clone the public VisualHFT repository, inspect the implementation, open an issue, or contribute independently of the commercial beta.
The Product in 15 Seconds
The animated campaign closes on the same outcome sequence covered in this article: estimate the order before execution, find the liquidity that fits, see fragmentation across venues, and explain the resulting fill with evidence.
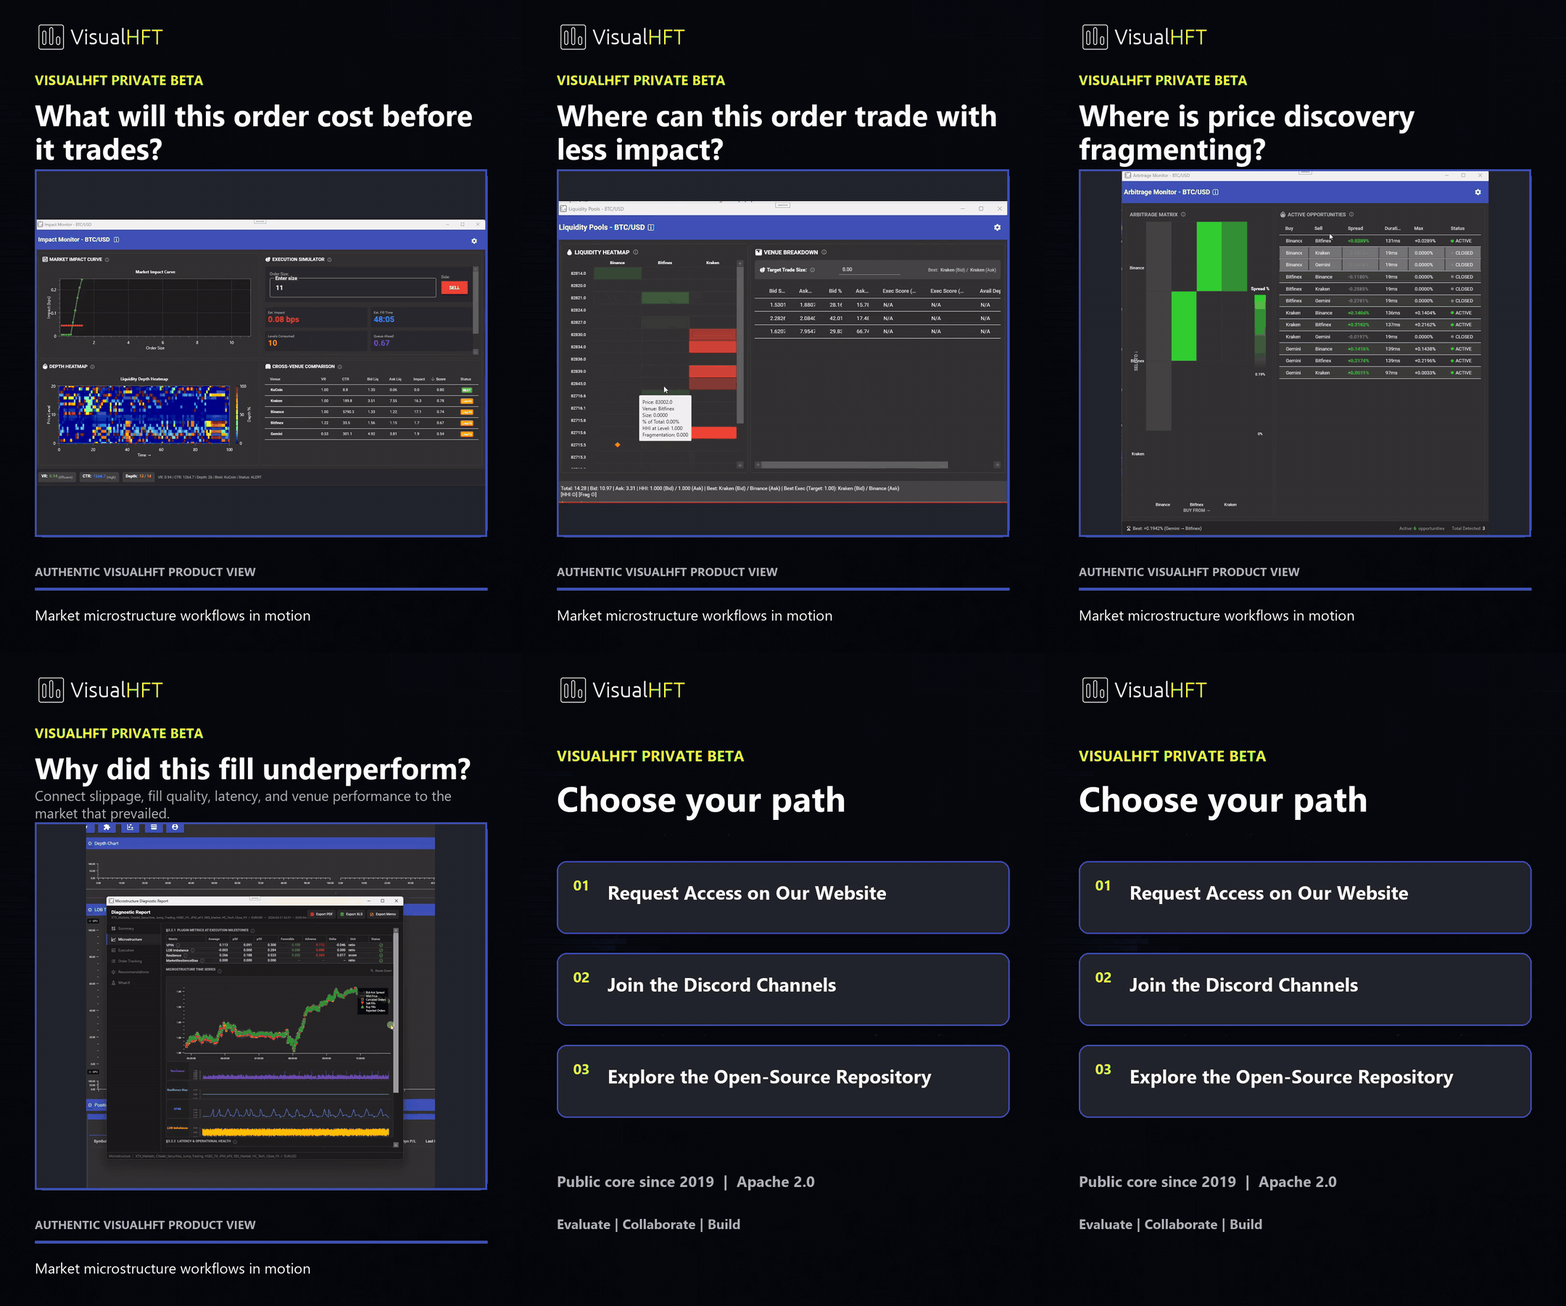
Request access on the website, join the Discord channels, or work directly with the open-source repository.