Everything you need to see your market.
Real-time analytics built for the speed of electronic trading.
Predictive Market Analytics
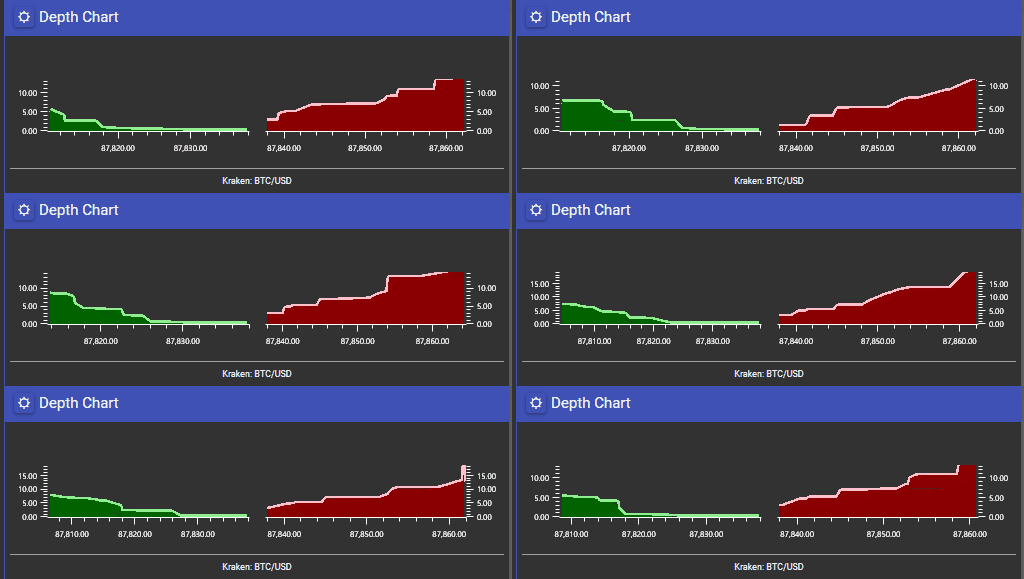
Depth Chart
Depth chart showing liquidity distribution across price levels.
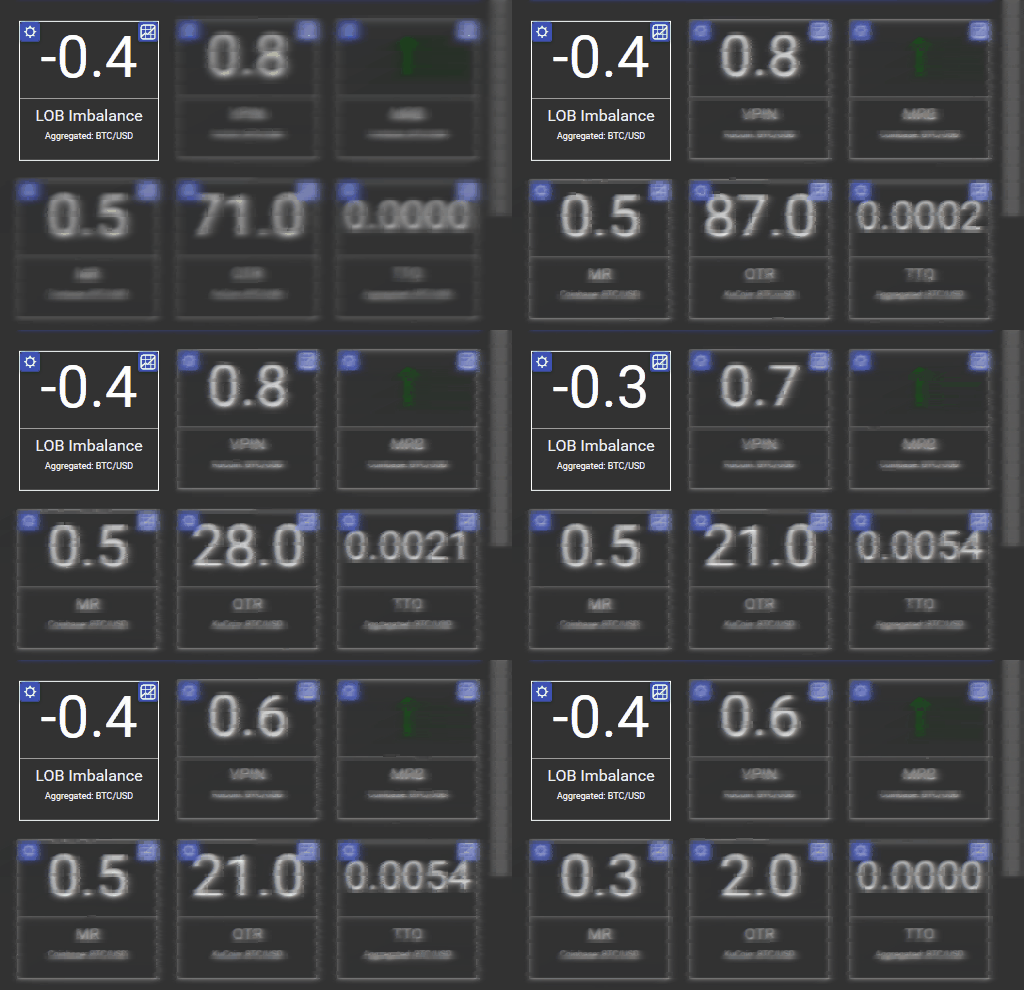
LOB Imbalance Study
Calculates Limit Order Book Imbalances.
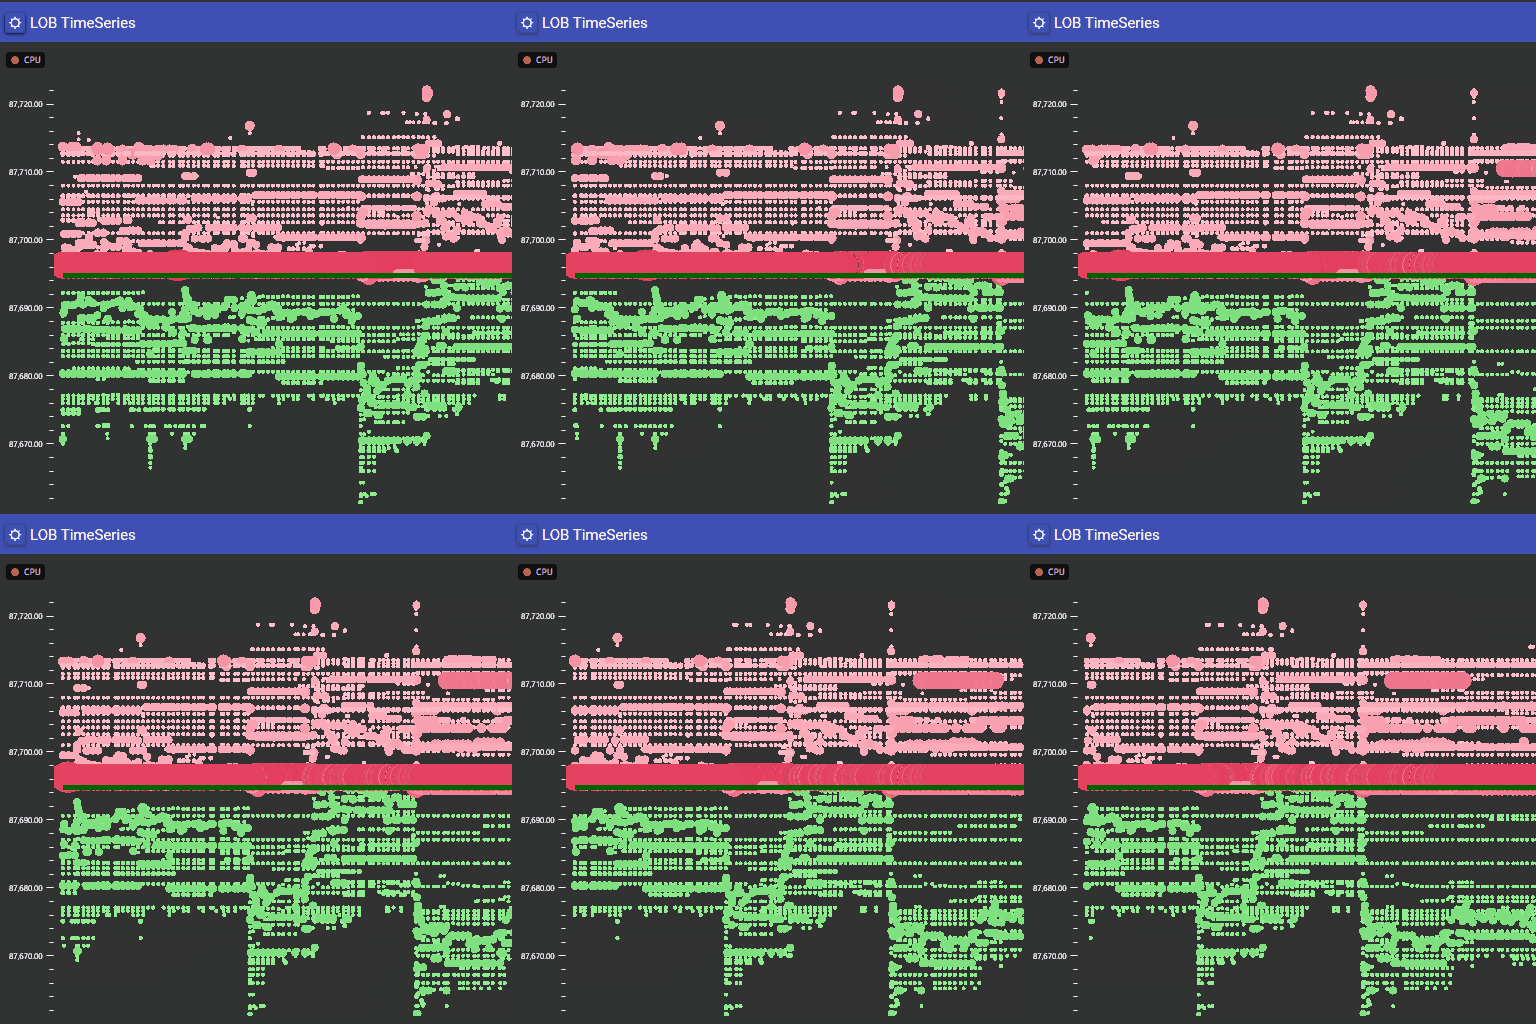
LOB TimeSeries Chart
Chart showing rolling bid/ask/mid prices, level-size points, and spread.
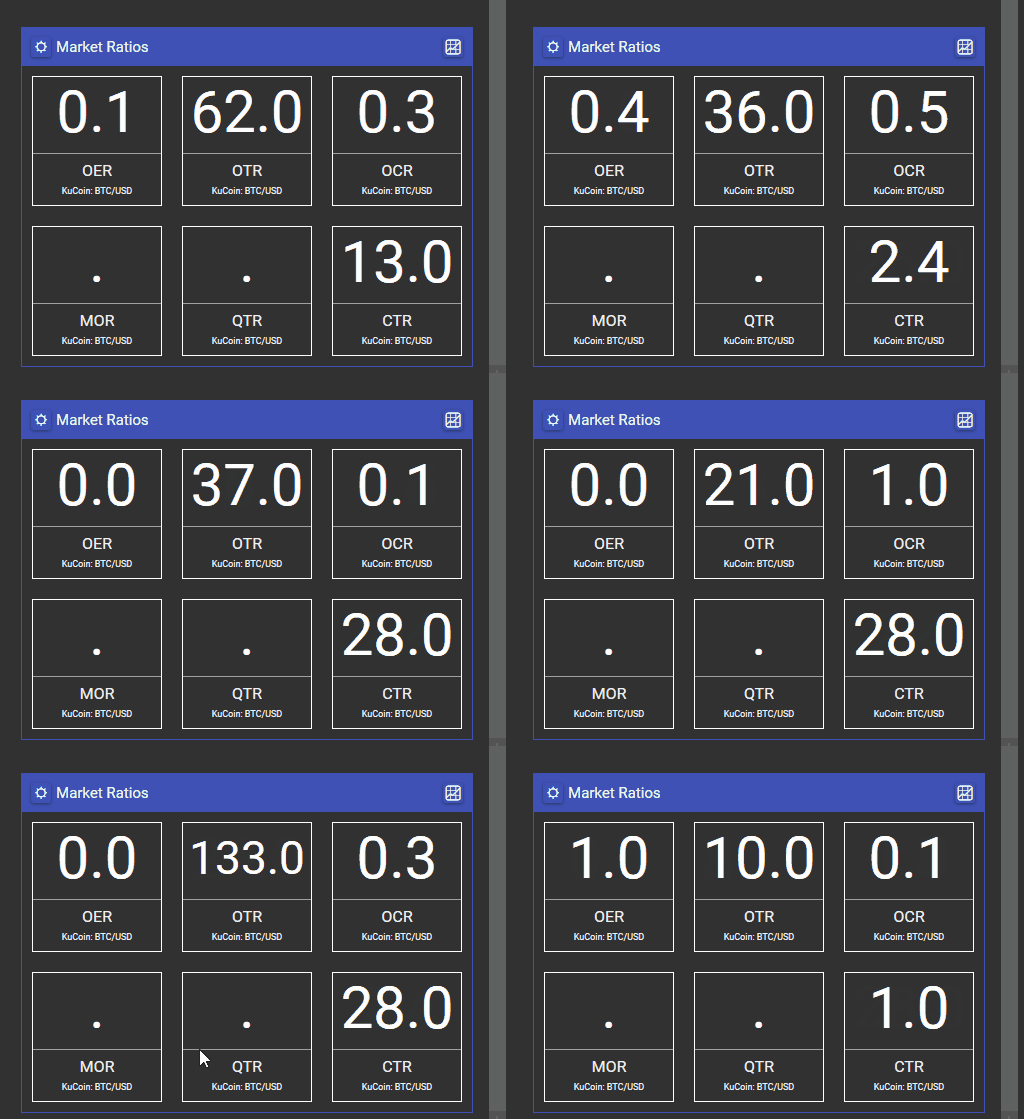
Market Ratios Study
Calculates six critical market microstructure ratios (OER, OTR, OCR, MOR, QTR, CTR) for comprehensive order flow analysis, liquidity assessment, and regulatory compliance monitoring.
Market Resilience Bias
Reads a directional lean from how the order book behaves after a large trade. Builds on the Market Resilience score and adds which side of the book was depleted. Scored +1 bullish, -1 bearish, 0 neutral.
Market Resilience Study
Measures how the order book absorbs and recovers from a large trade. Blends recovery speed, judged against this instrument's own recent history, with the size of the shock itself. Descriptive, not predictive, and carries no directional information.
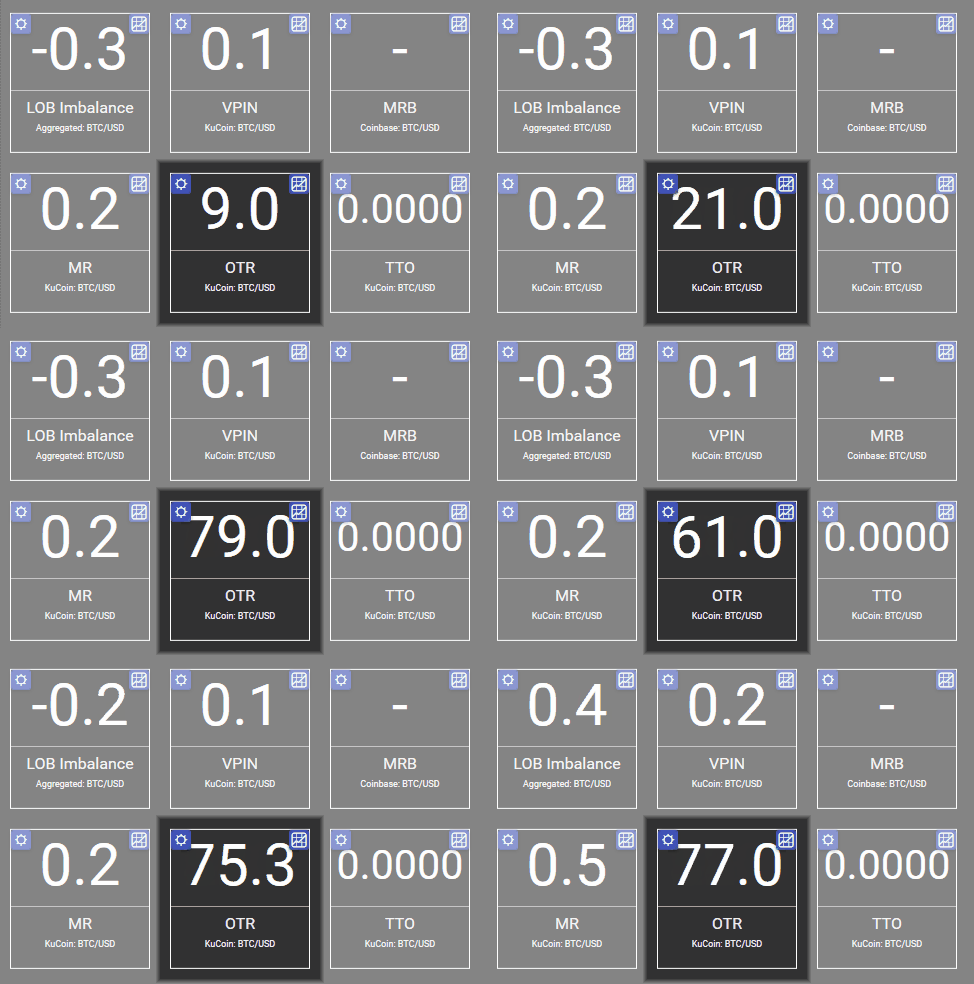
Order-to-Trade Ratio
Order-to-Trade Ratio from public market data, as message counts (default) or posted size. A public-data proxy, not a venue's regulatory ratio.
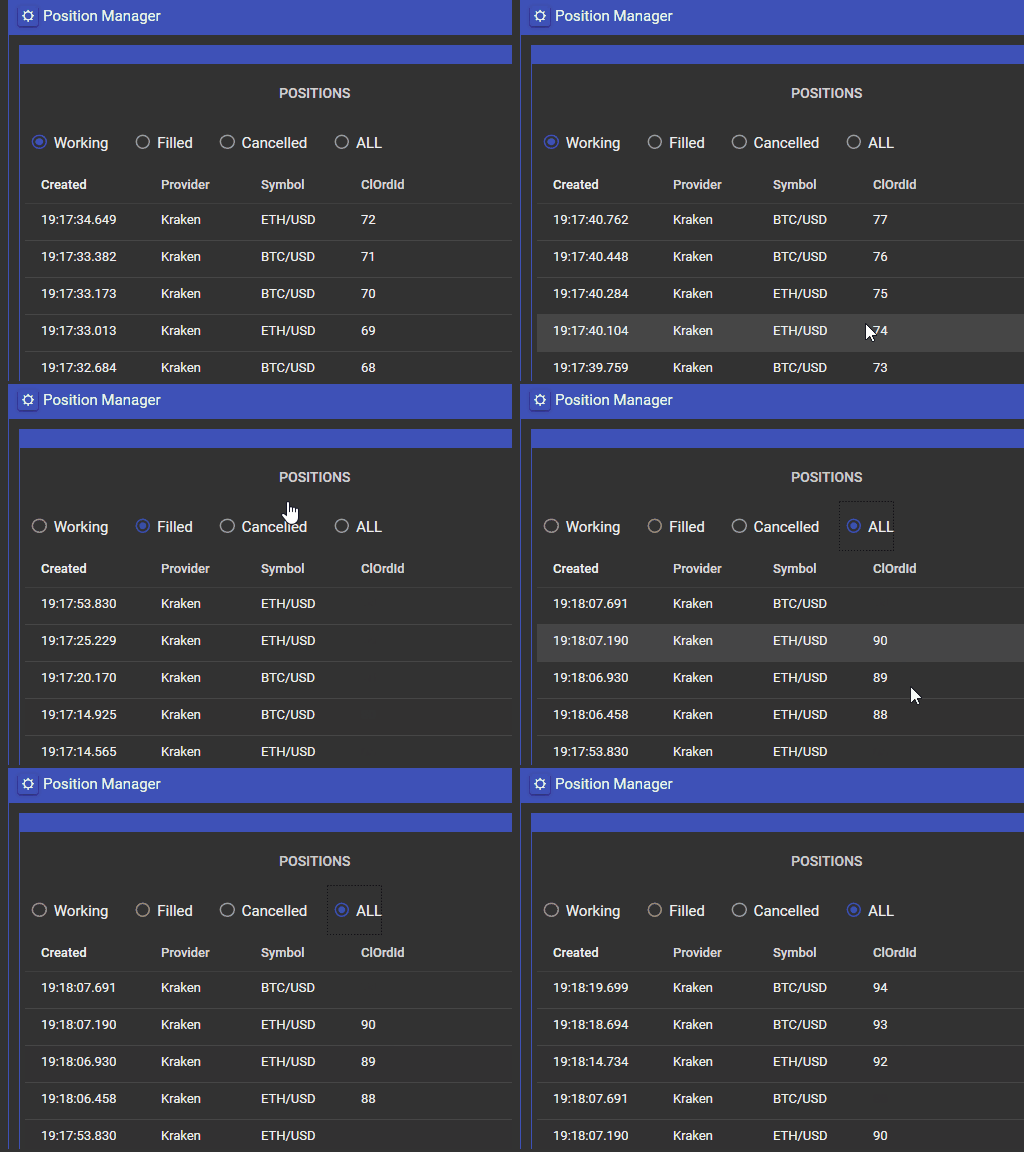
Position Manager
Real-time tracking and management of active orders, positions, fills, and P&L.
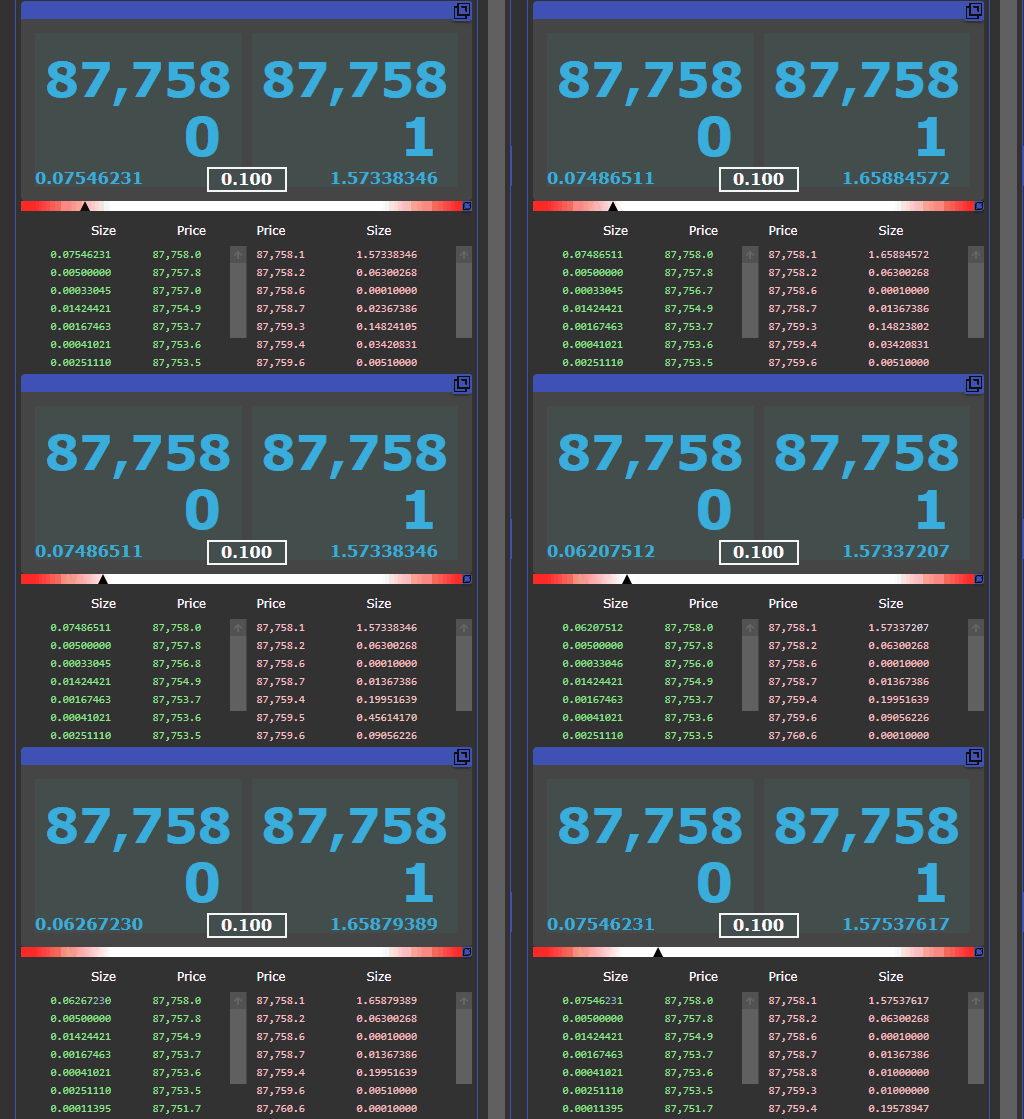
Quotes & Level 2 DOM
Top-of-book quotes with full Level 2 order book depth in one view.
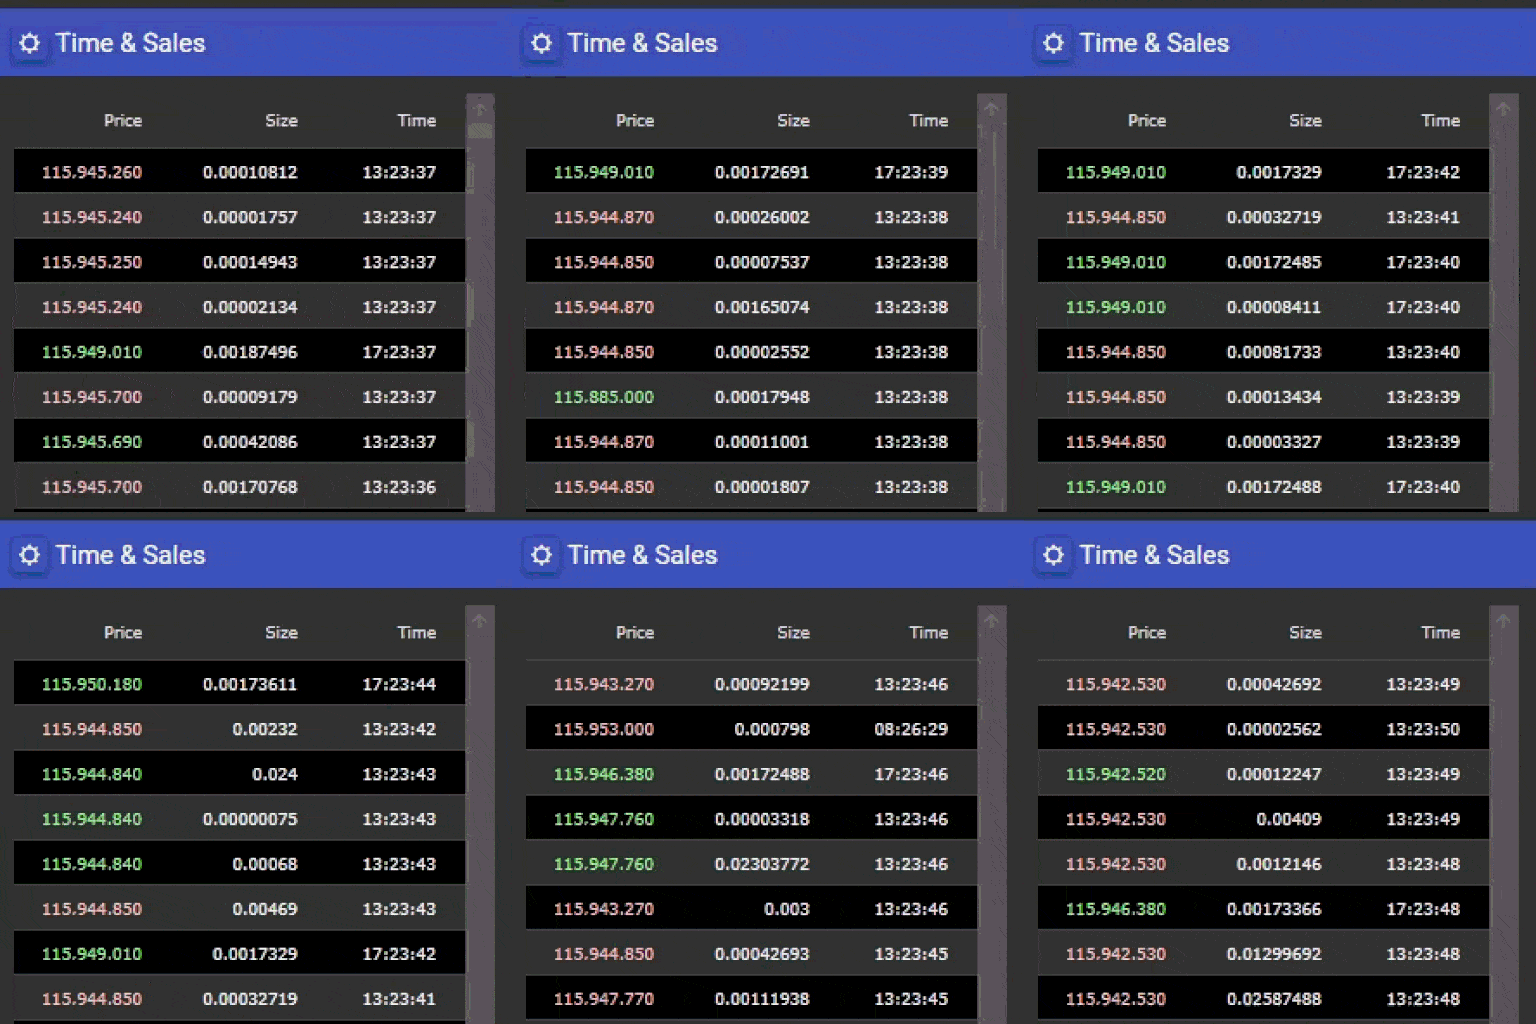
Time & Sales
Displays real-time trade data including price, size, and time.
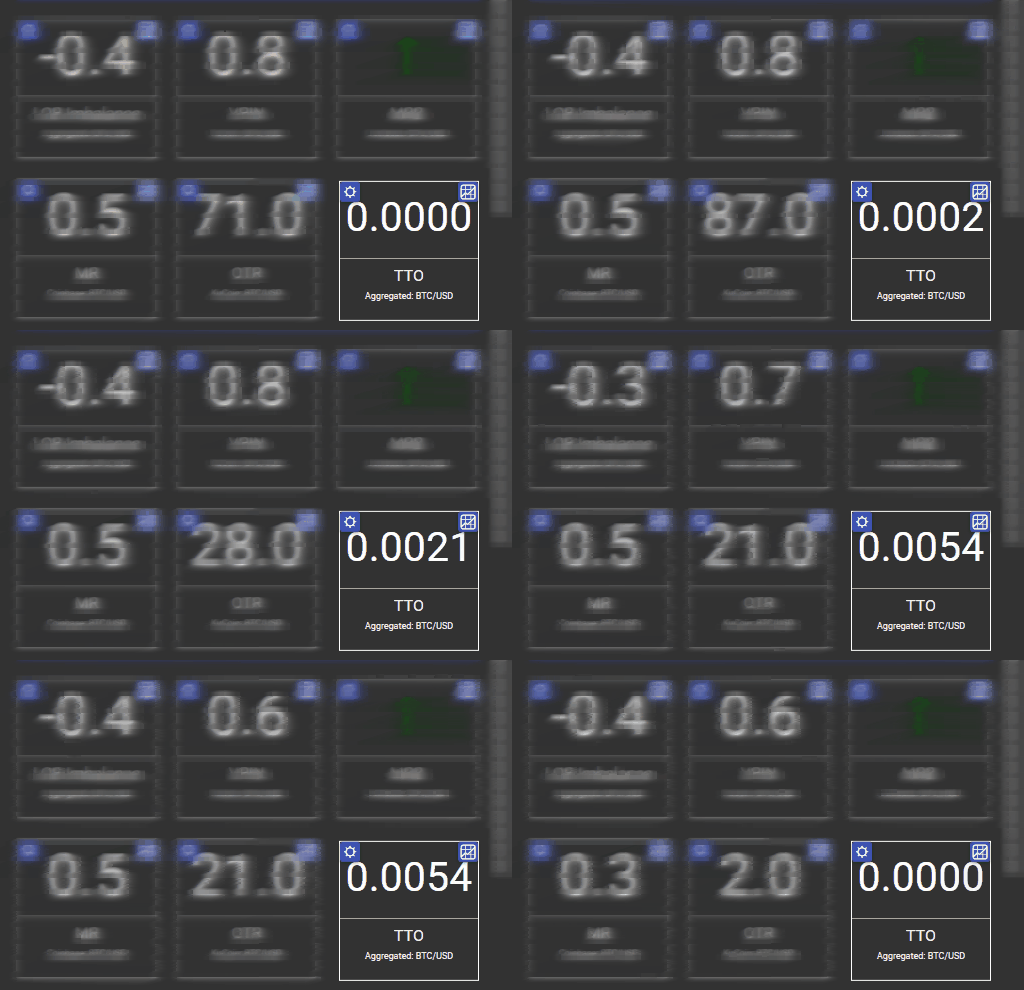
Trade-to-Order Ratio
Trade-to-Order Ratio from public market data, as a legacy per-window figure (default) or a corrected SEC-aligned percentage. Not the SEC's own exchange-wide statistic.
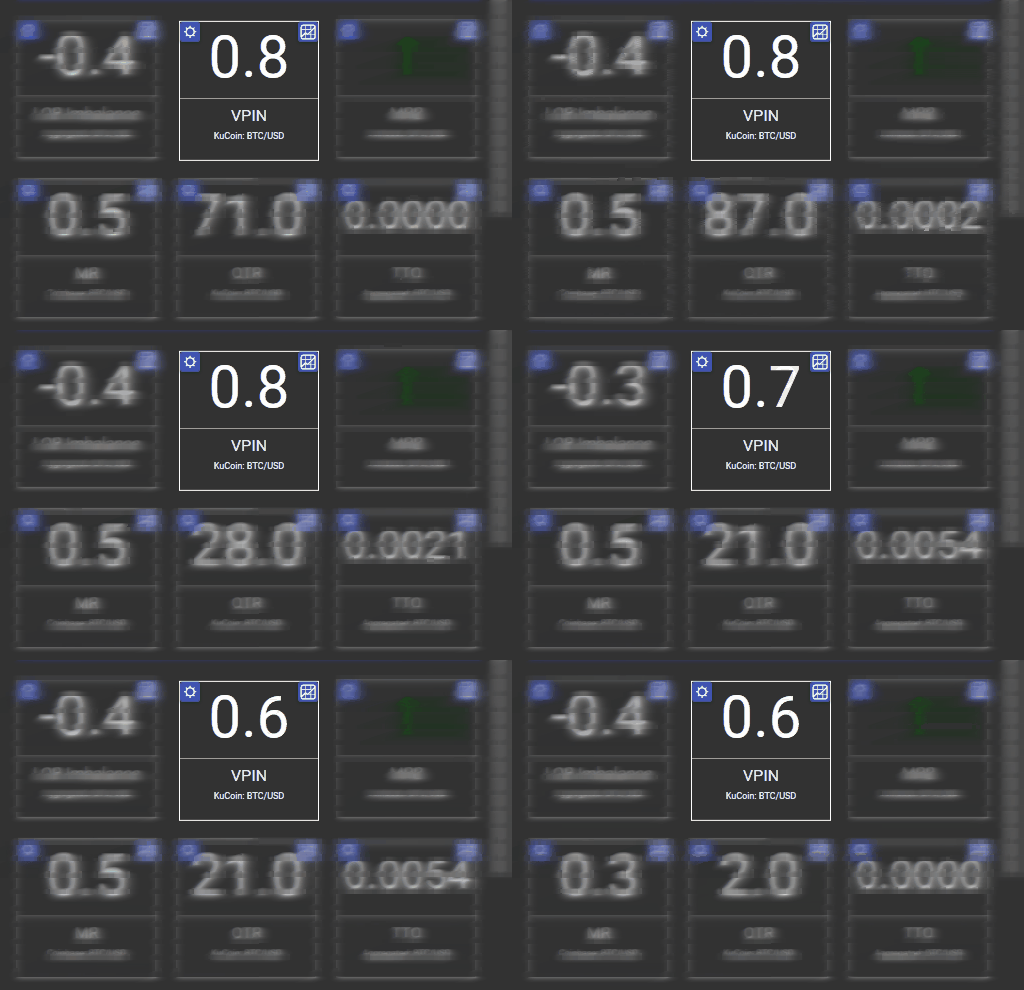
VPIN Study
VPIN (Volume-Synchronized Probability of Informed Trading) groups trades into buckets of equal traded volume and shows the average absolute buy/sell imbalance across the last n buckets, on a 0-1 scale. Despite its name it is not a probability. Its bucket volume decides what it reads: a bucket too small to hold many trades reports its own size rather than the flow.
Liquidity & Order Flow
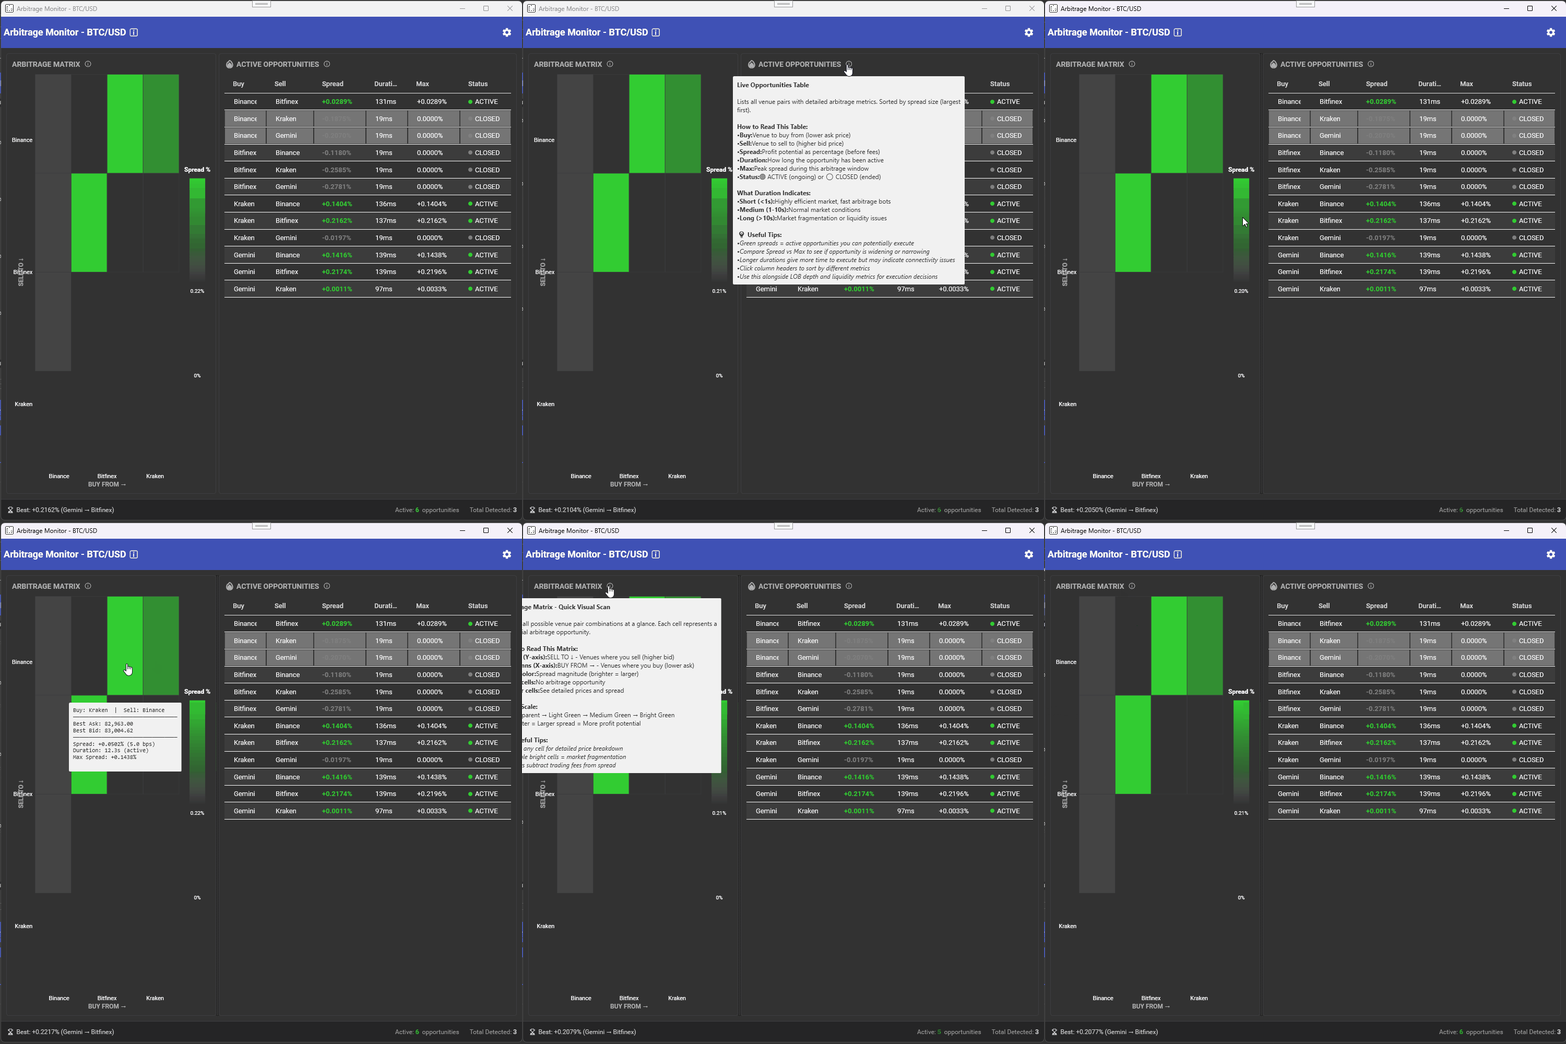
Arbitrage Monitoring
Identifies cross-venue price gaps for risk-free profit opportunities. Matrix heatmap, live opportunities table, session stats.
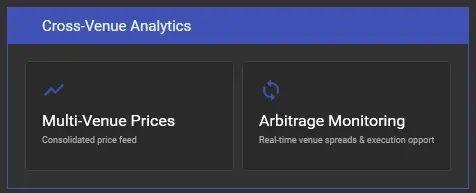
Cross-Venue Analytics
Cross-Venue Analytics provides multi-venue market analysis tools. Includes Multi-Venue Prices (consolidated price feed chart) and Arbitrage Monitoring (real-time venue spreads). Click any tool to launch it in an independent window.
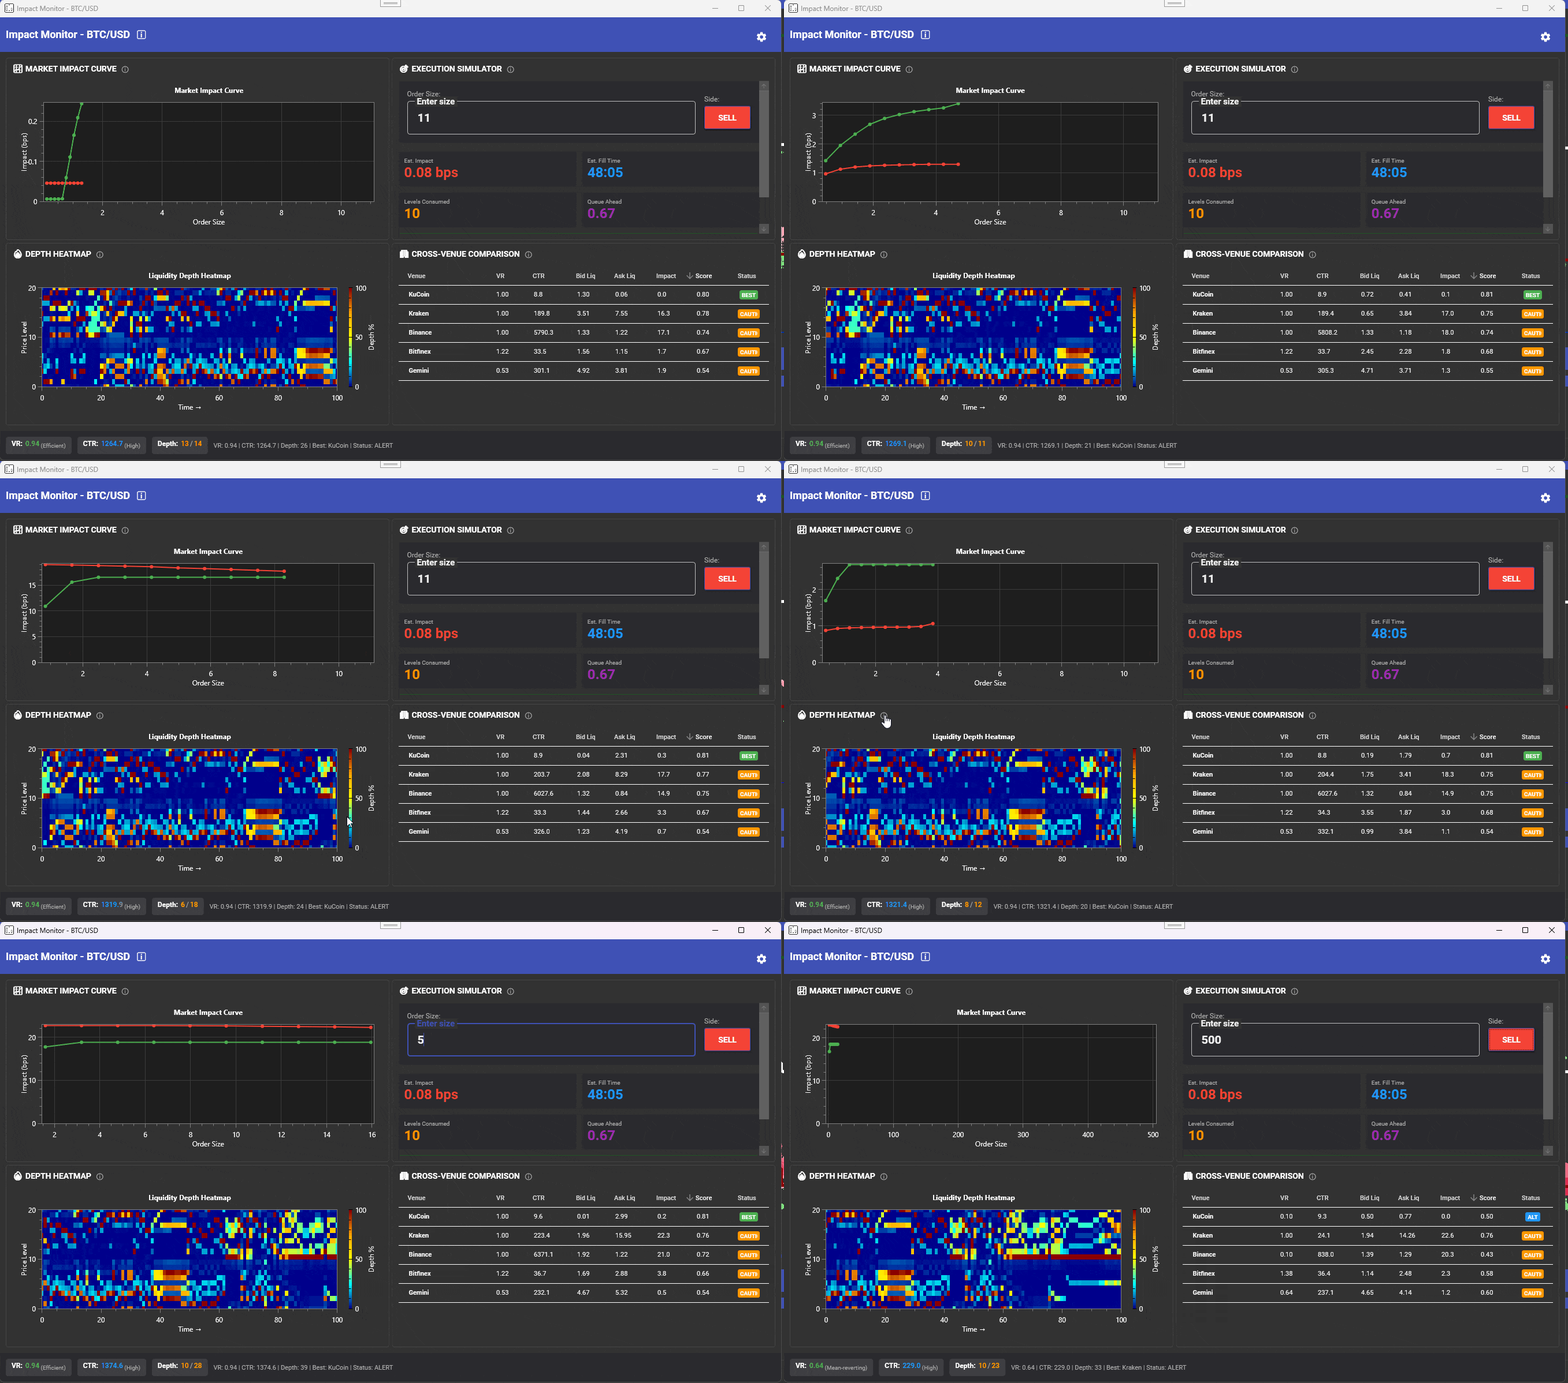
Impact Monitor
Pre-trade analytics tool that answers 'What will this order cost me?' before execution.
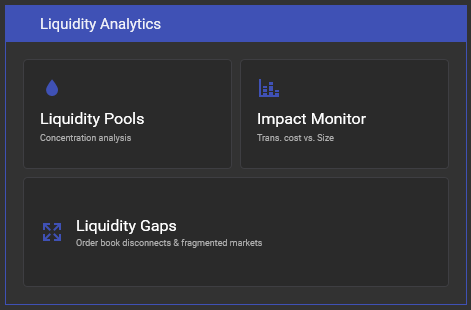
Liquidity Analytics
The Liquidity Analytics plugin offers liquidity analysis tools: Liquidity Pools (heatmap), Impact Monitor (cost vs. size), and Liquidity Gaps (order book disconnects). Click any tool to launch independently.
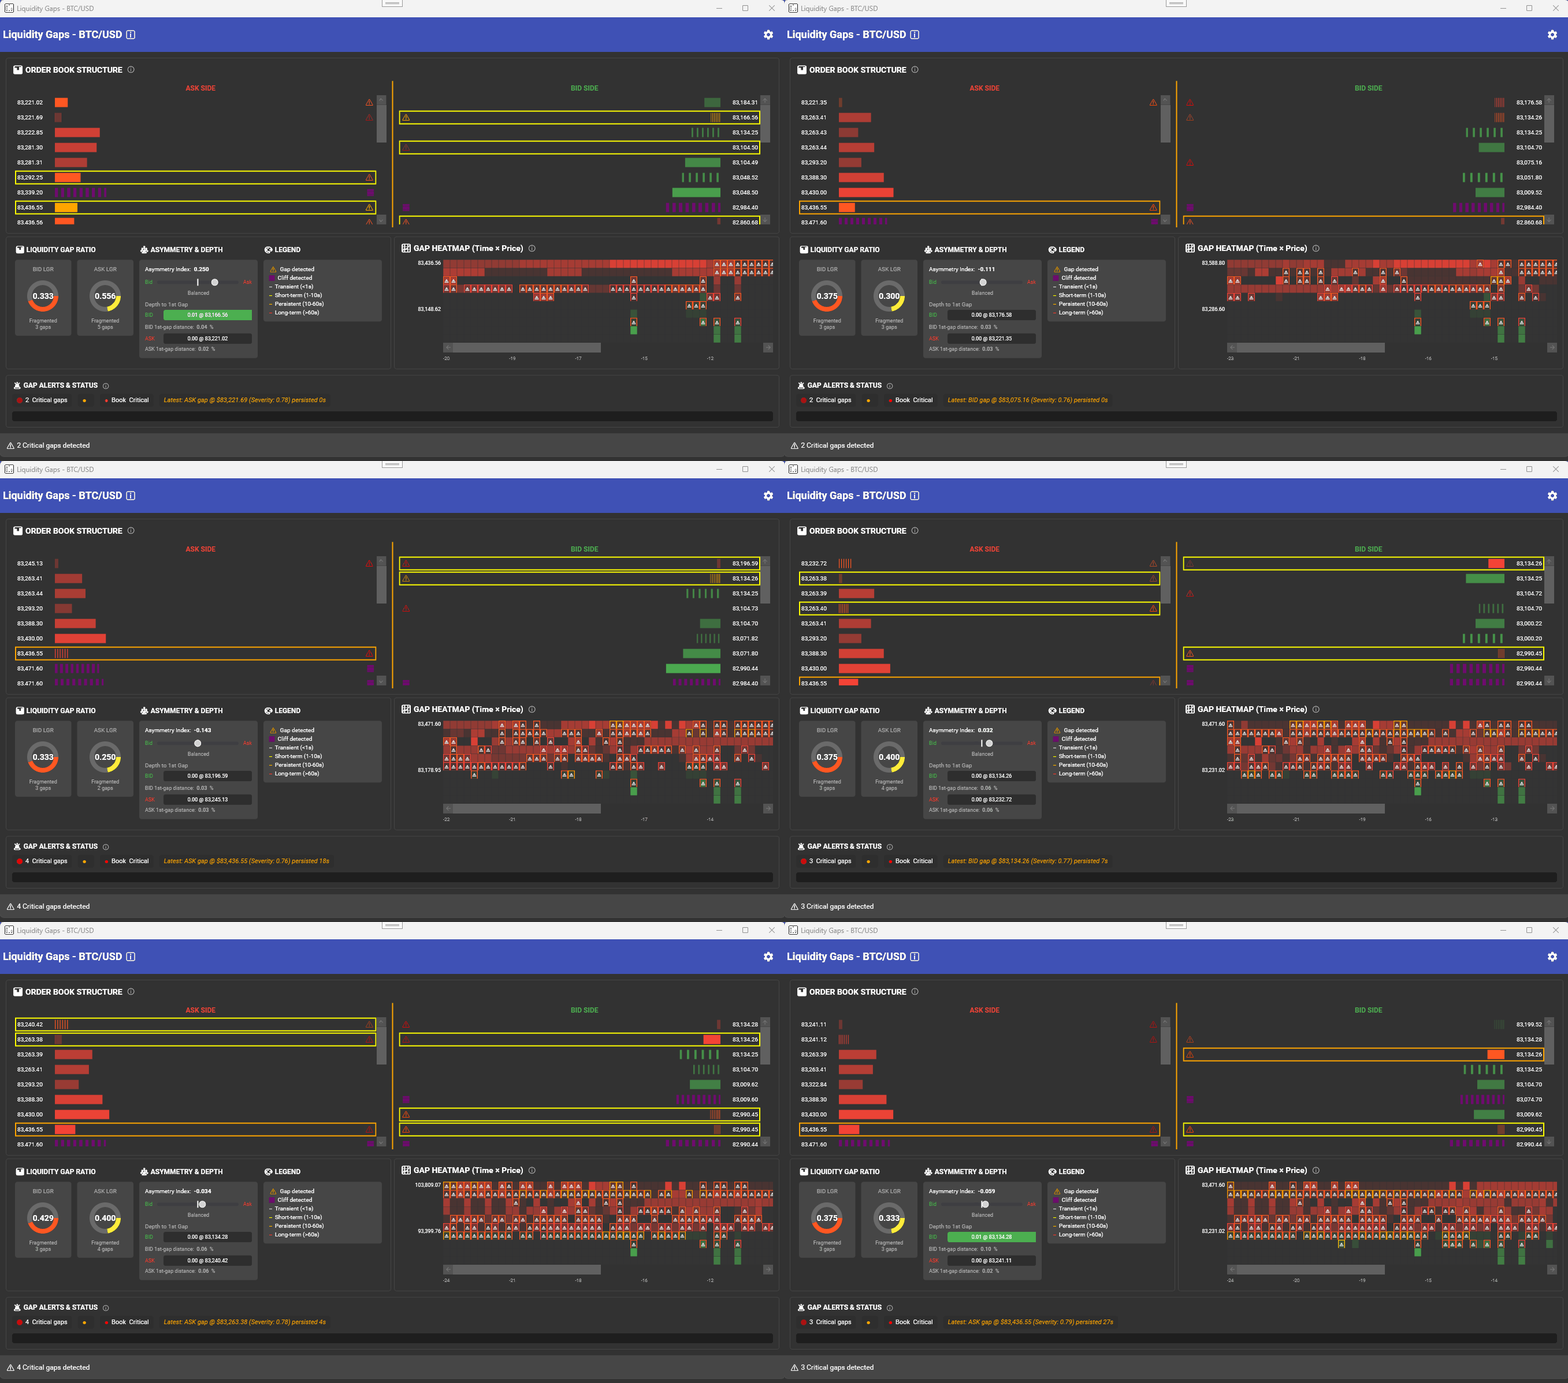
Liquidity Gaps
Identifies structural order book weaknesses (gaps, cliffs) that cause price jumps. Monitors gap severity, persistence, and distribution.
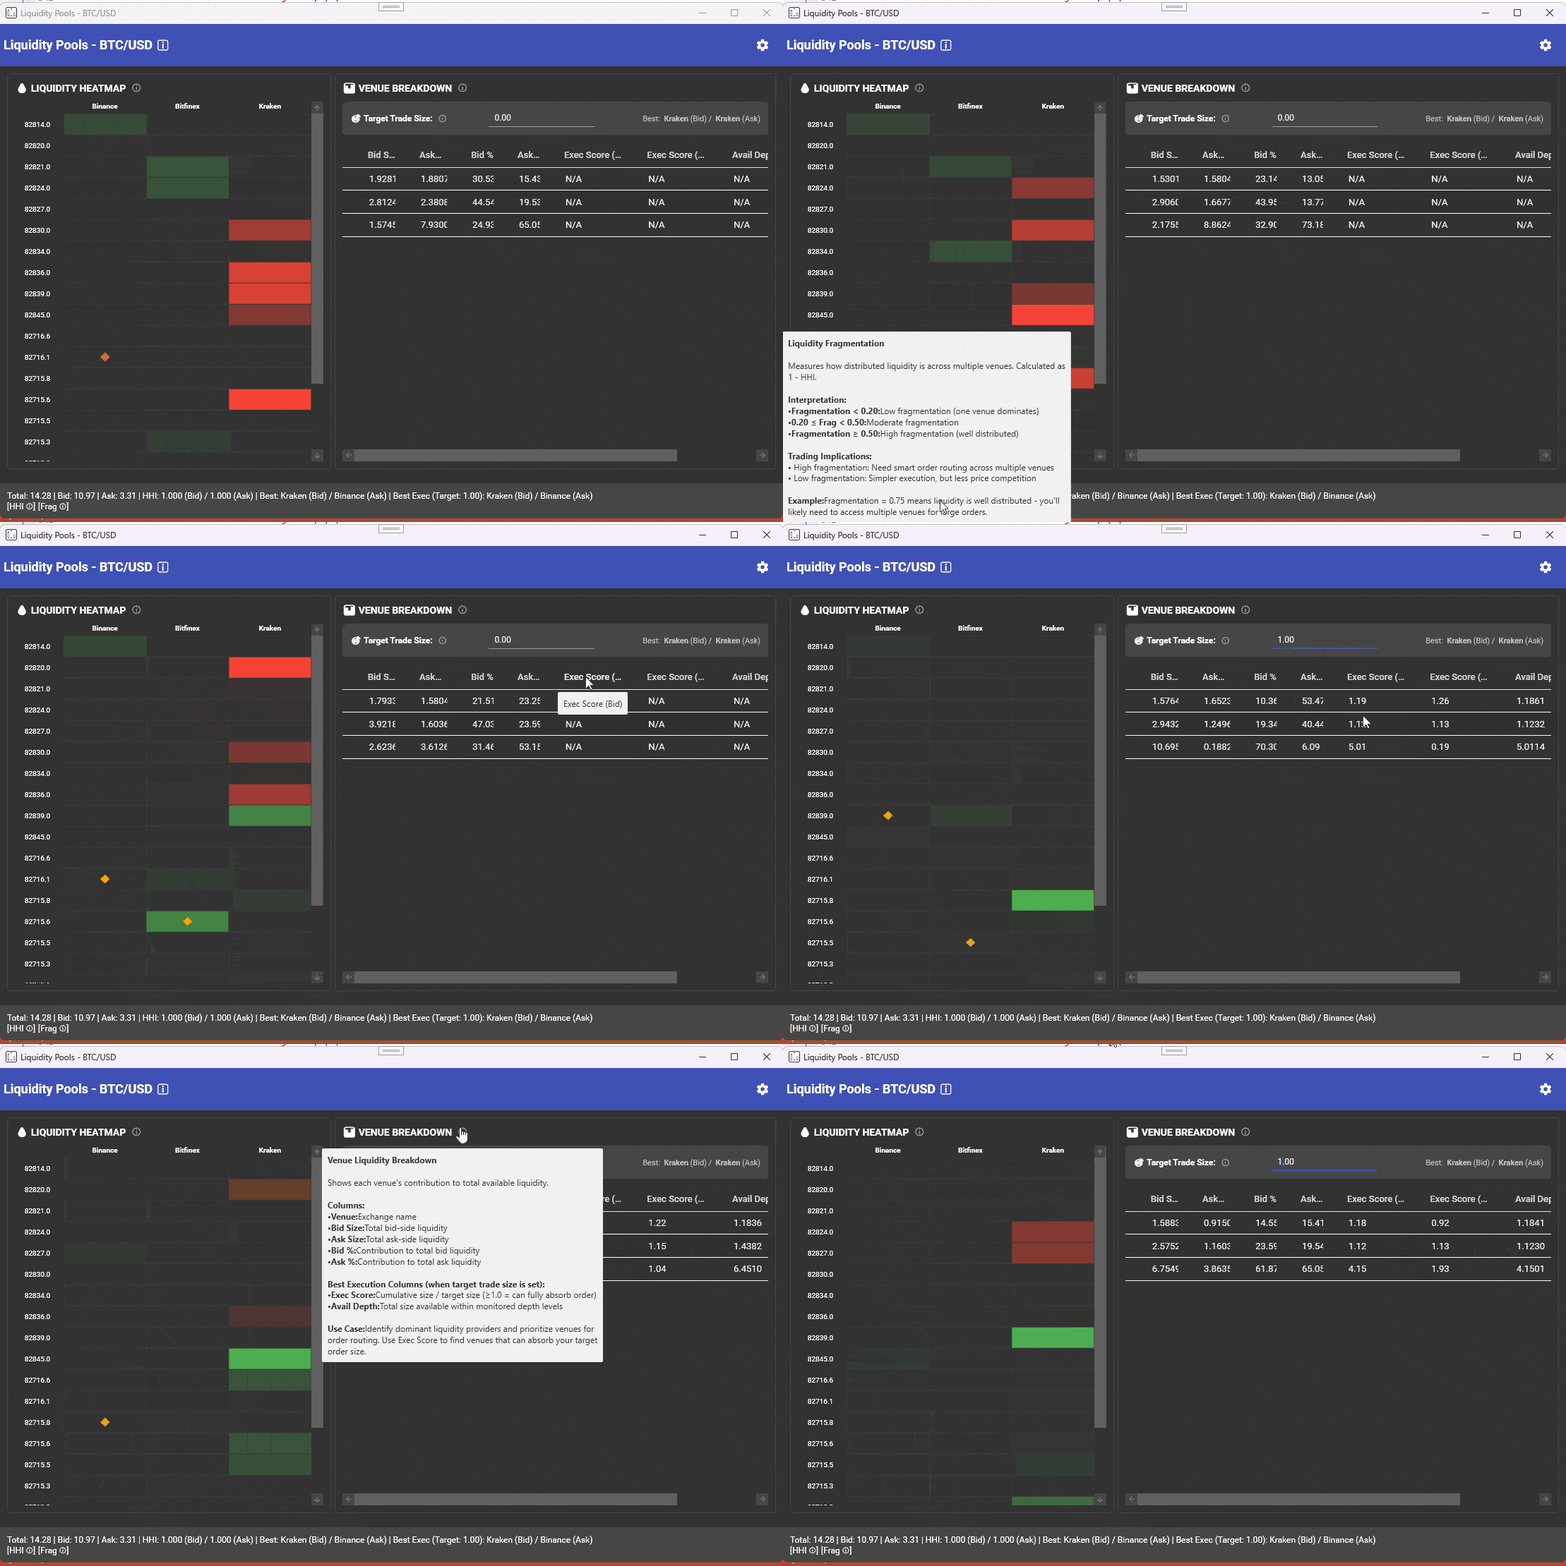
Liquidity Pools
Visualizes liquidity concentration across venues via heatmaps to identify optimal execution with minimal impact.
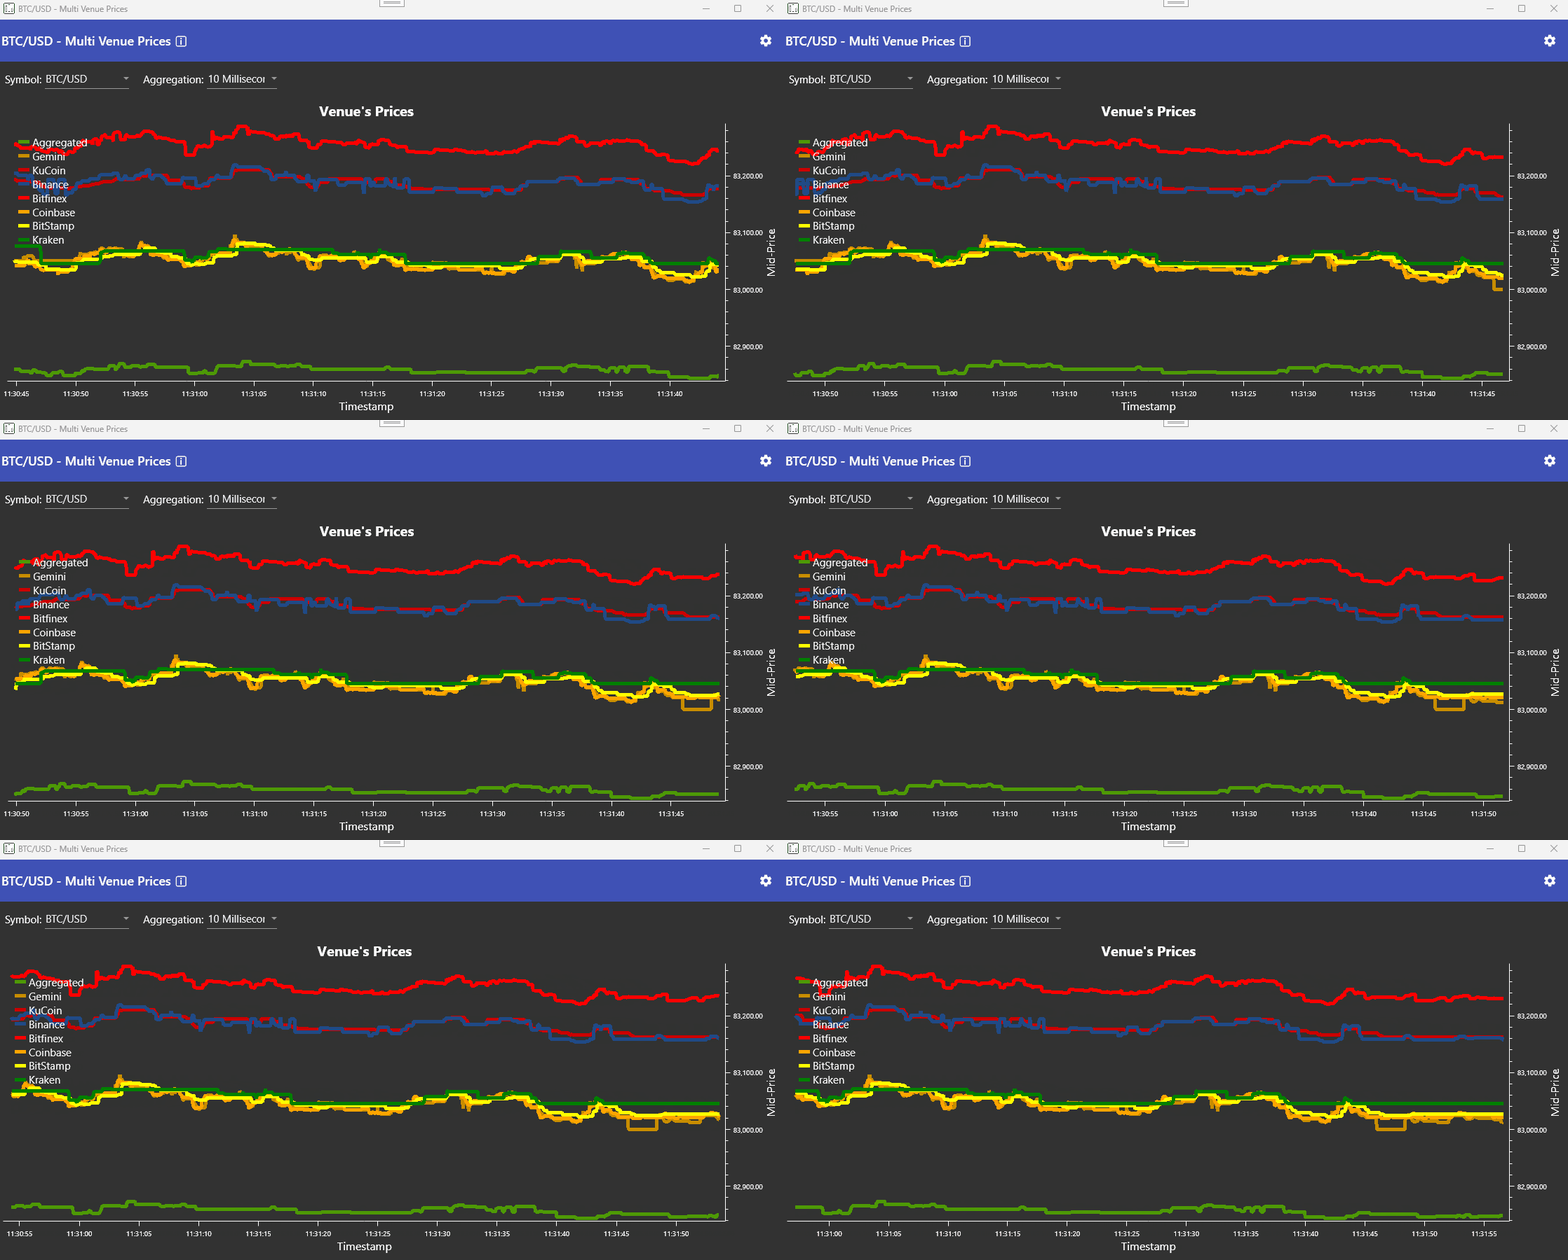
Multi-Venue Prices
Real-time mid-price chart across all venues for a symbol.
Infrastructure Monitoring
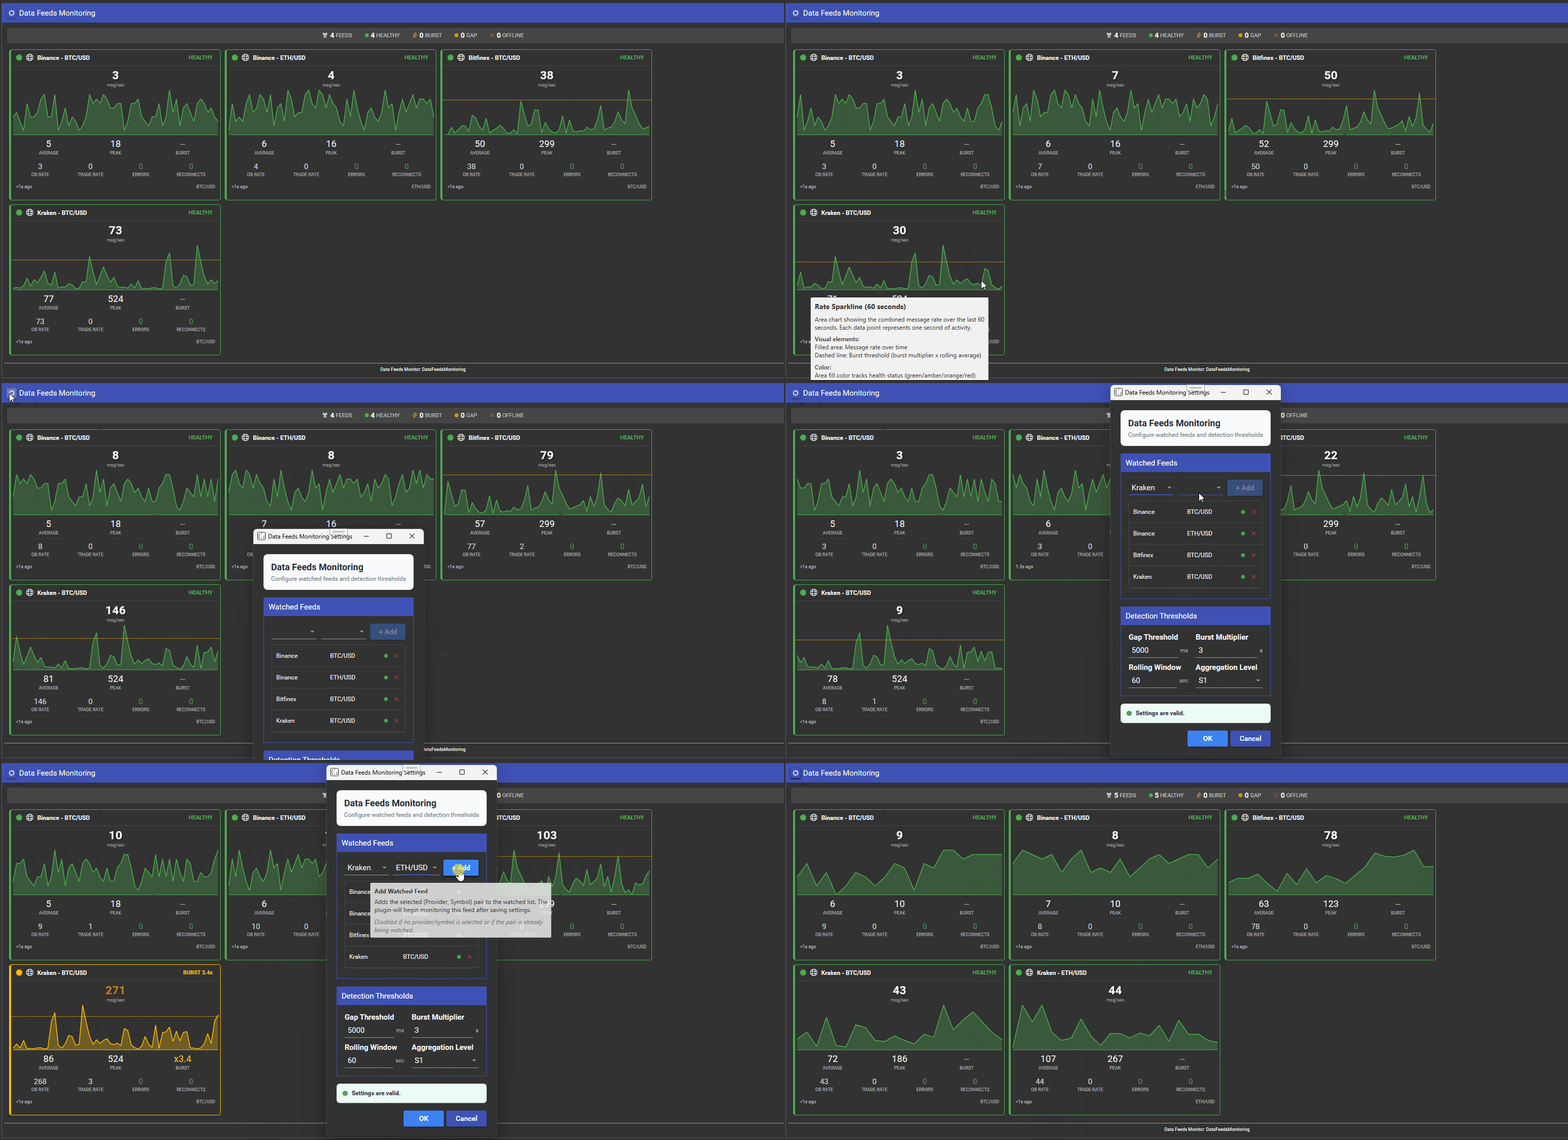
Data Feeds Monitoring
Monitors market data feed health: message rates, burst detection, gap detection, and operational errors per provider-symbol pair.
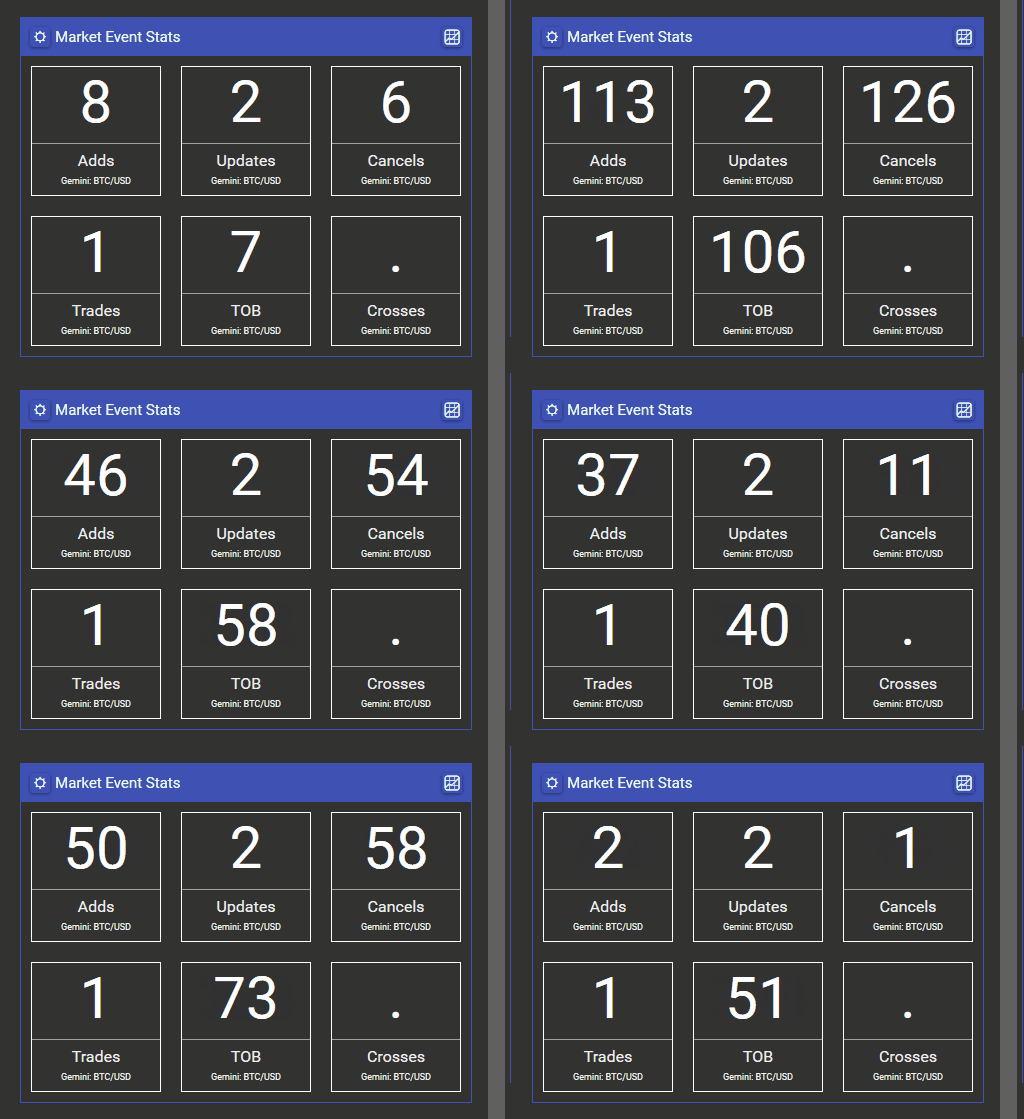
Market Event Stats
Count market events at the most granular way.
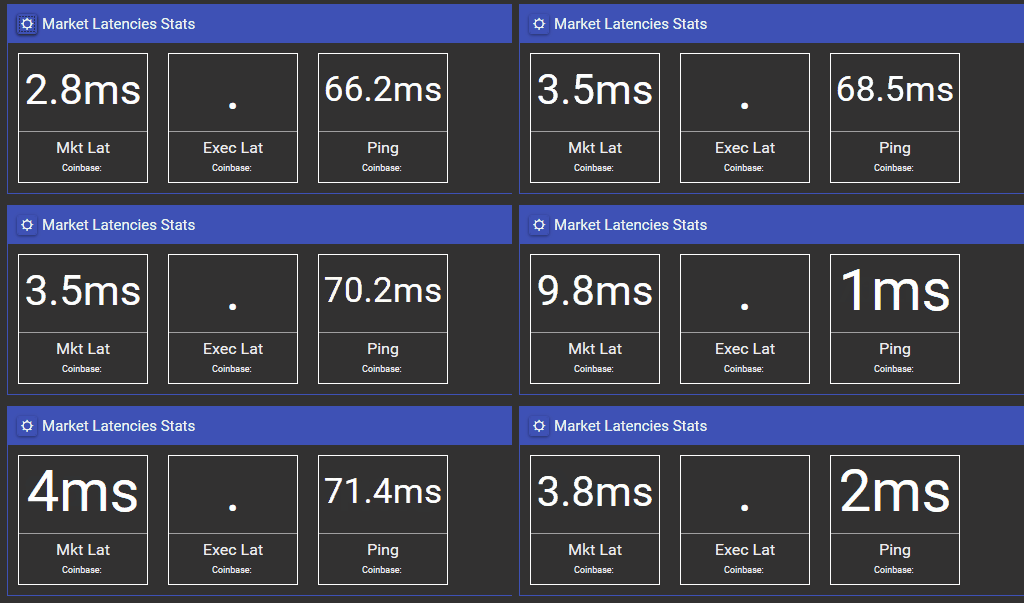
Market Latencies Stats
Measuring the latency of the exchange's matching engine, to monitor the health of the connectivity.
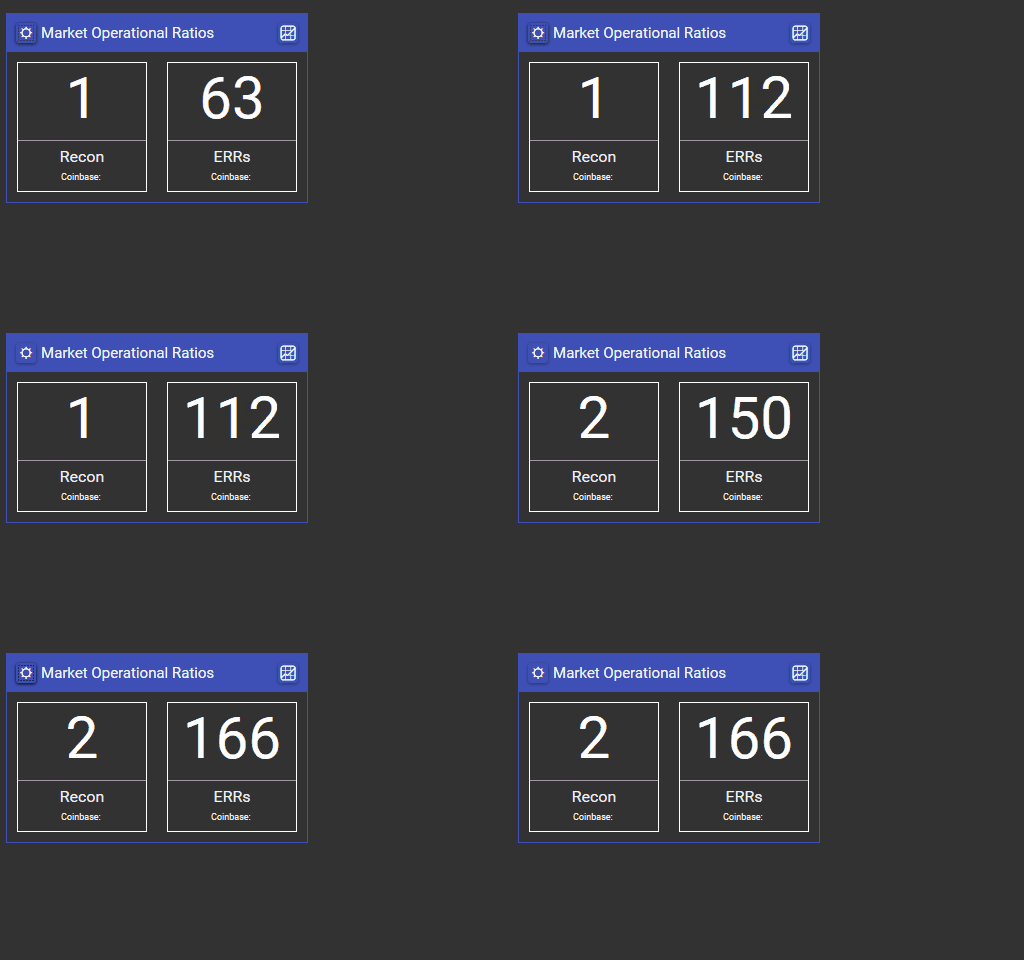
Market Operational Ratios
Operational metrics in the trading environment, to monitor the health of the system.
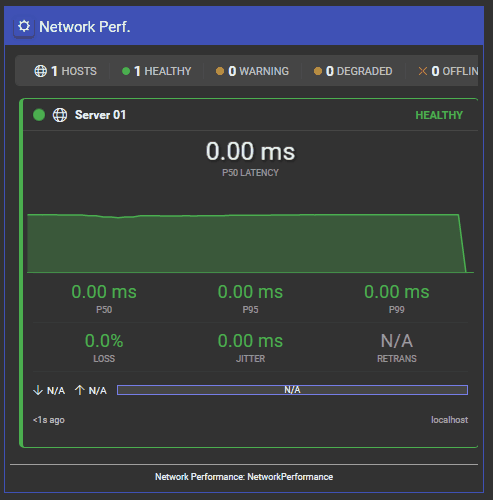
Network Performance Monitoring
Monitors network path quality (latency, loss, jitter) to remote trading servers.
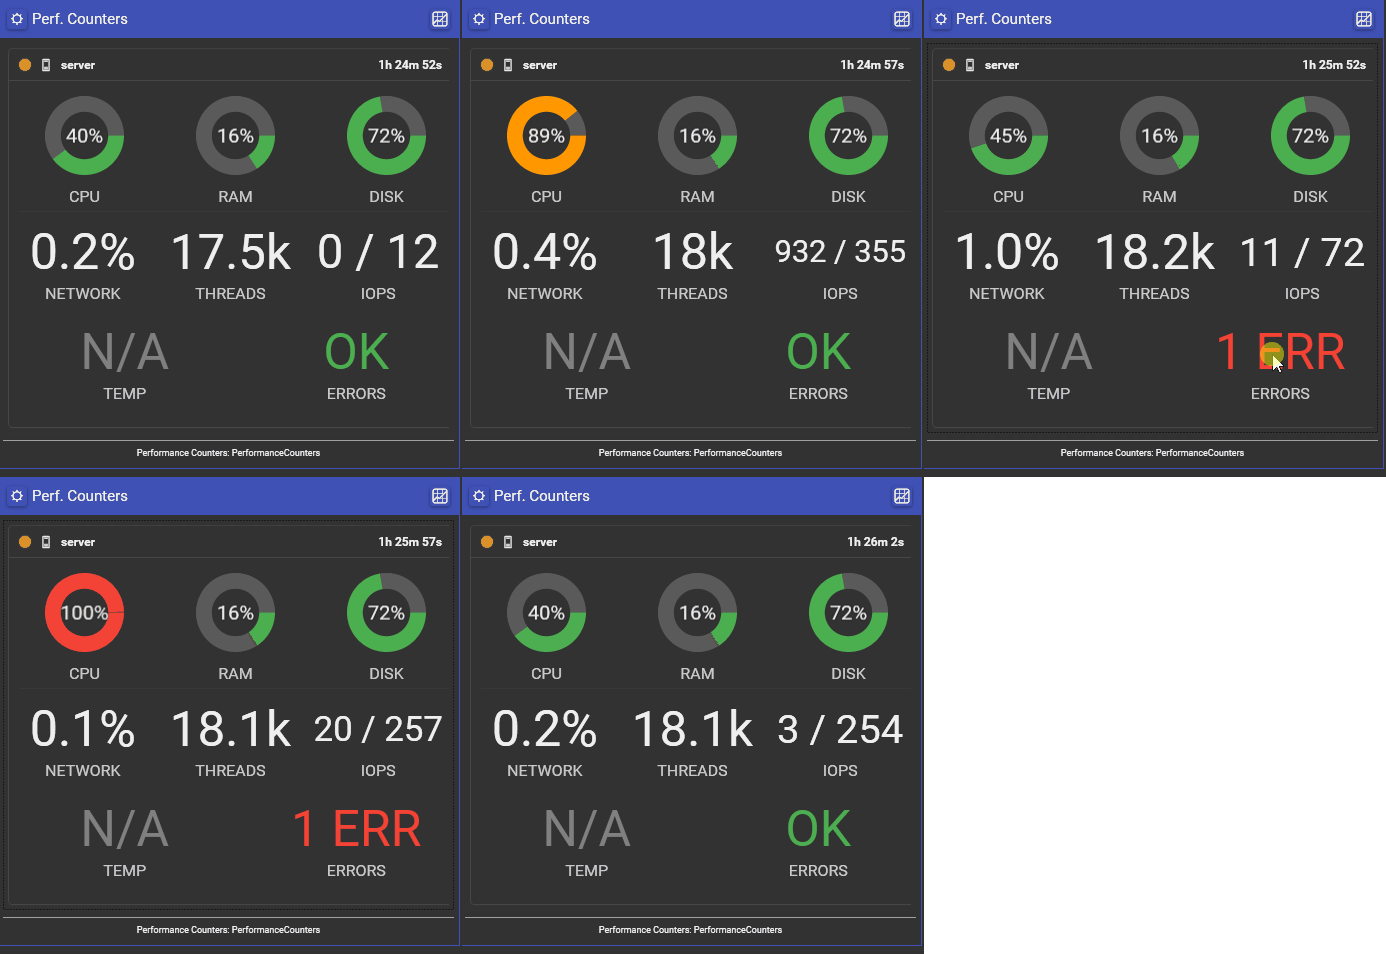
Performance Counters
Monitor real-time performance metrics from remote Windows and Linux servers including CPU, memory, disk, network utilization, and system health indicators.
Research & Data Capture
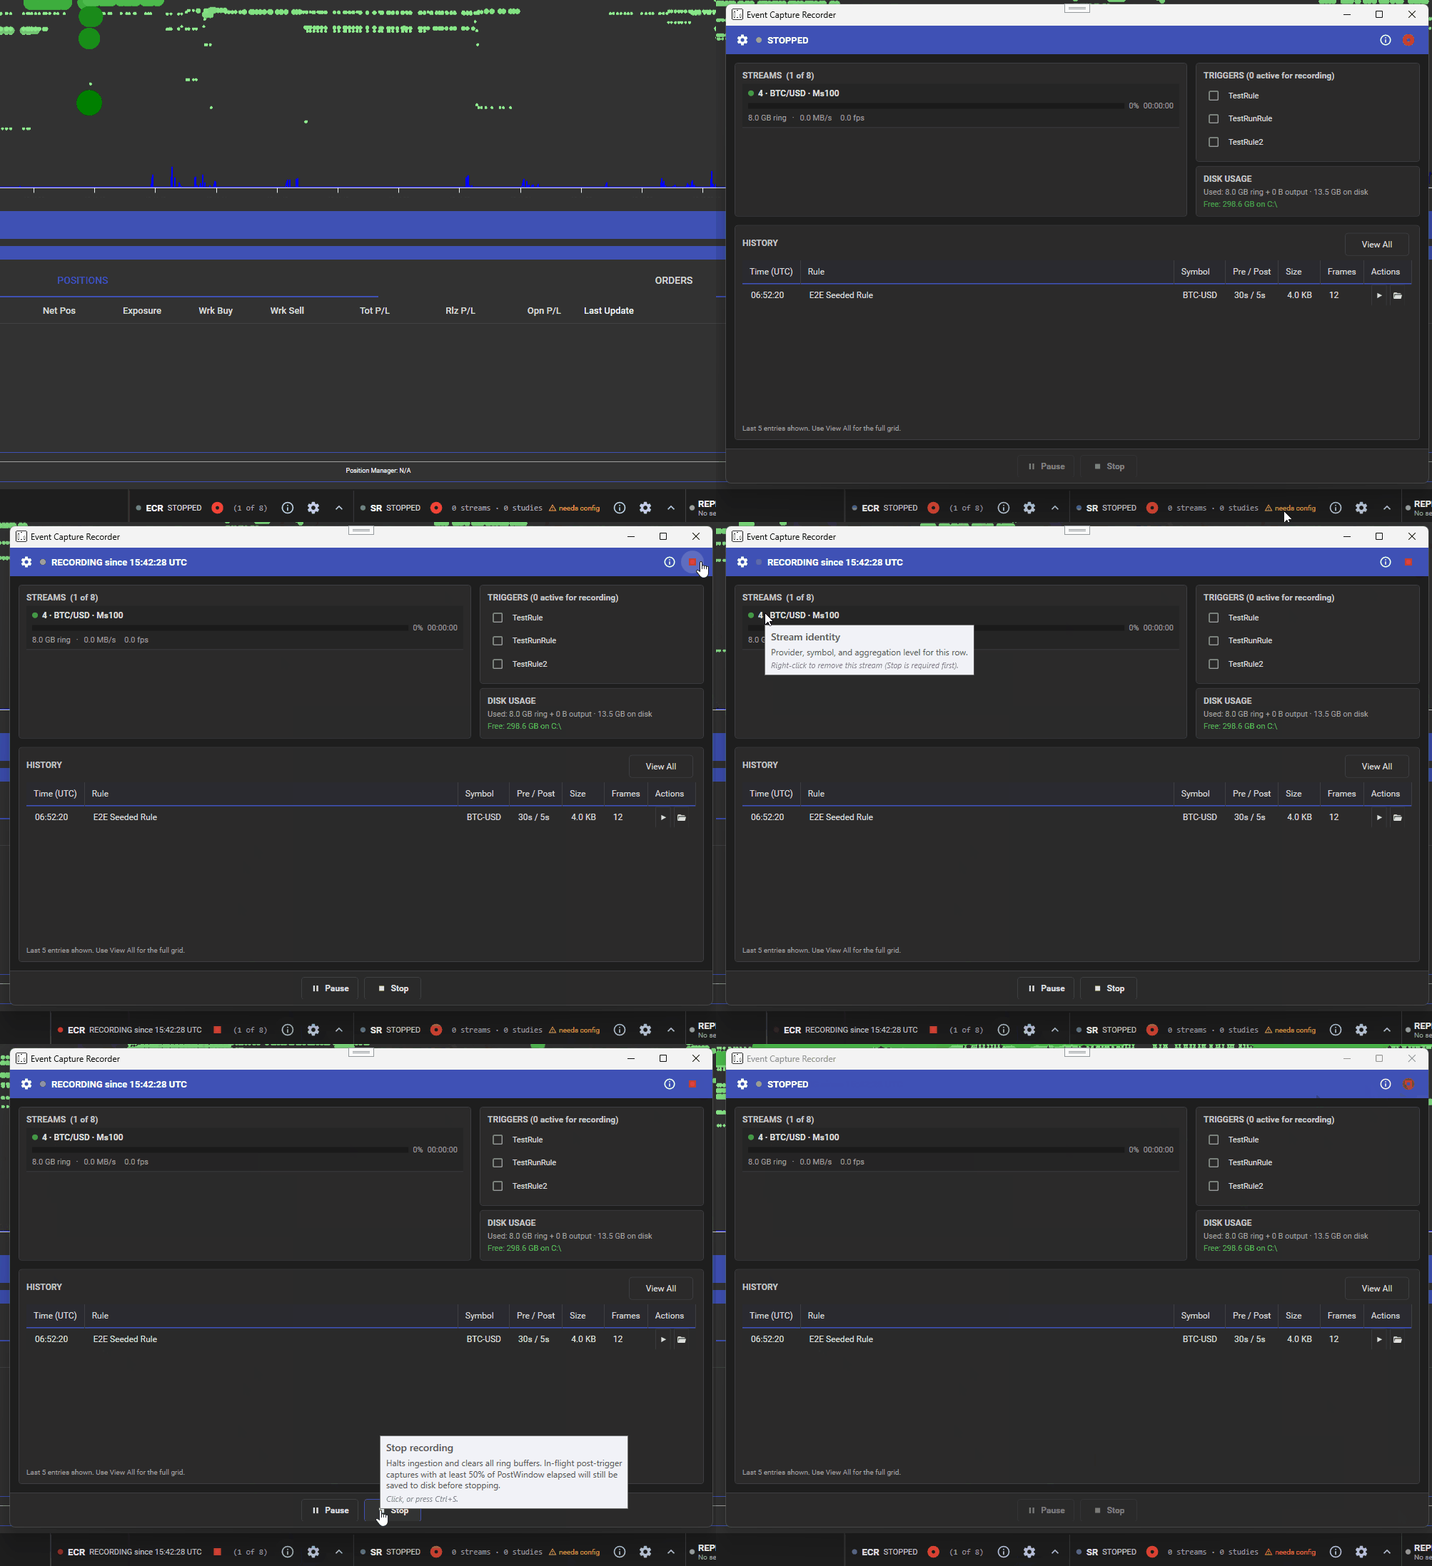
Event Capture Recorder
Trigger-driven forensic capture: continuously buffers live market data per stream and, on each TriggerEngine fire, writes a pre/post-event slice to a VHFT-BIN-1 file that loads into the Replay Engine for deterministic offline analysis.
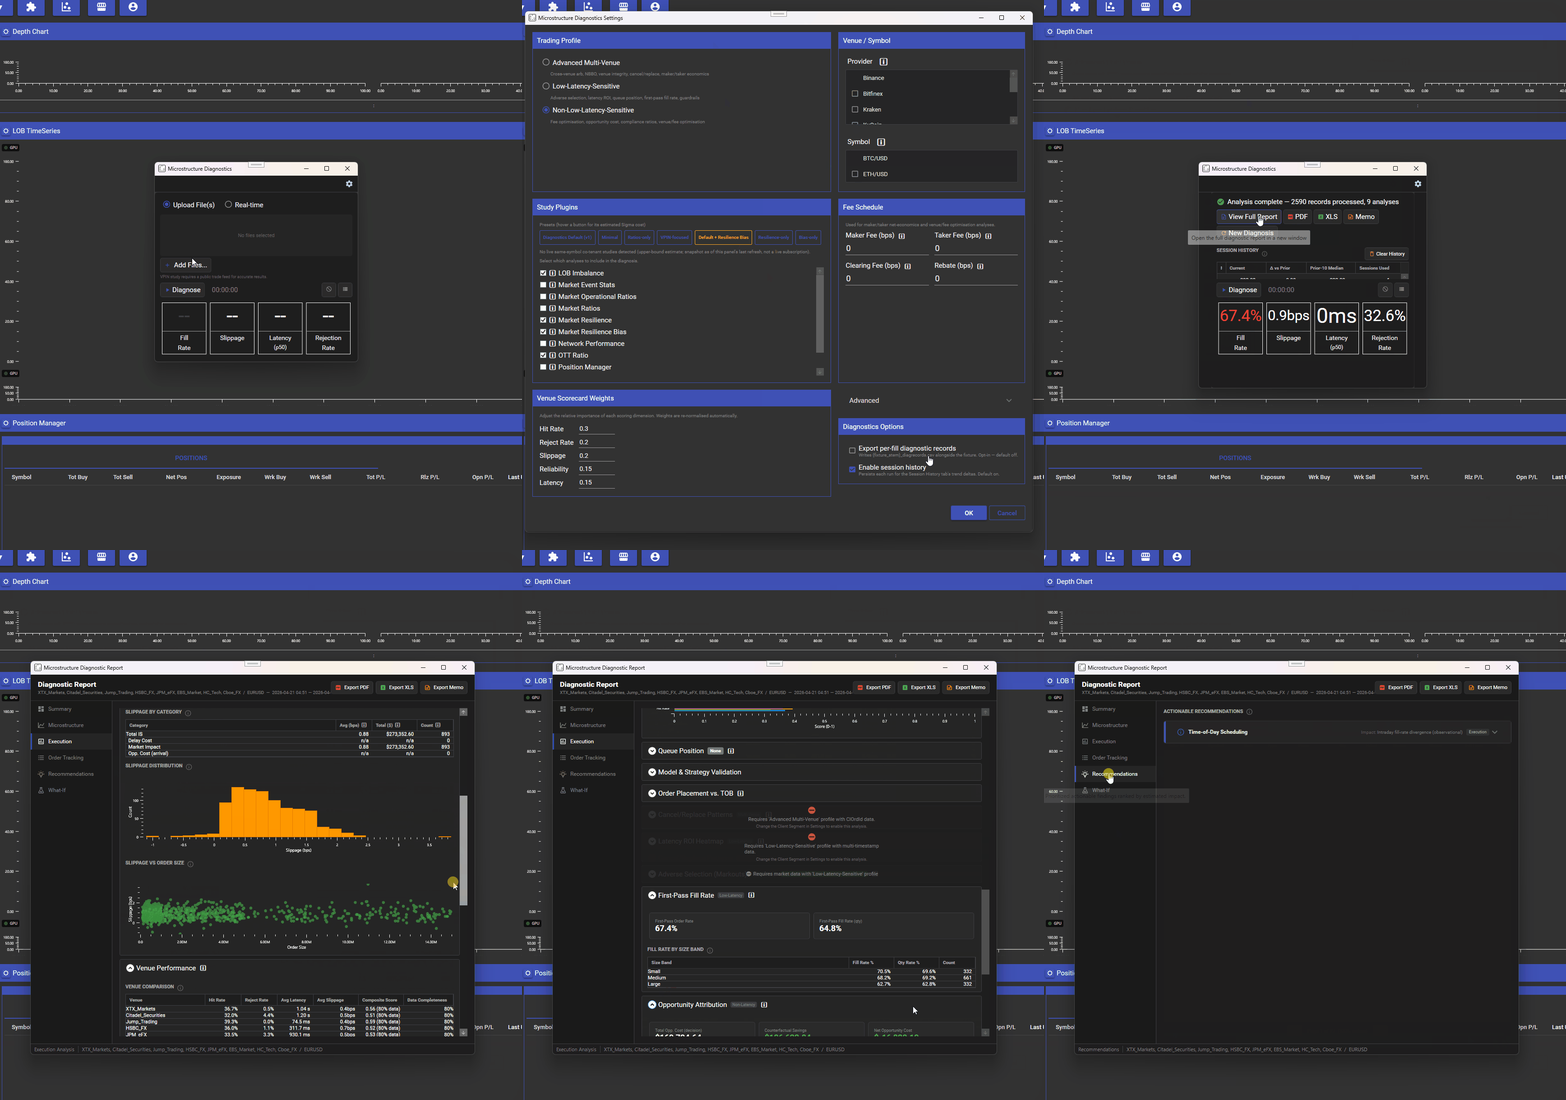
Microstructure Diagnostics
Post-trade transaction-cost analysis that replays your execution logs against captured market microstructure to diagnose slippage, fill quality, queue position, adverse selection, latency, and venue performance.
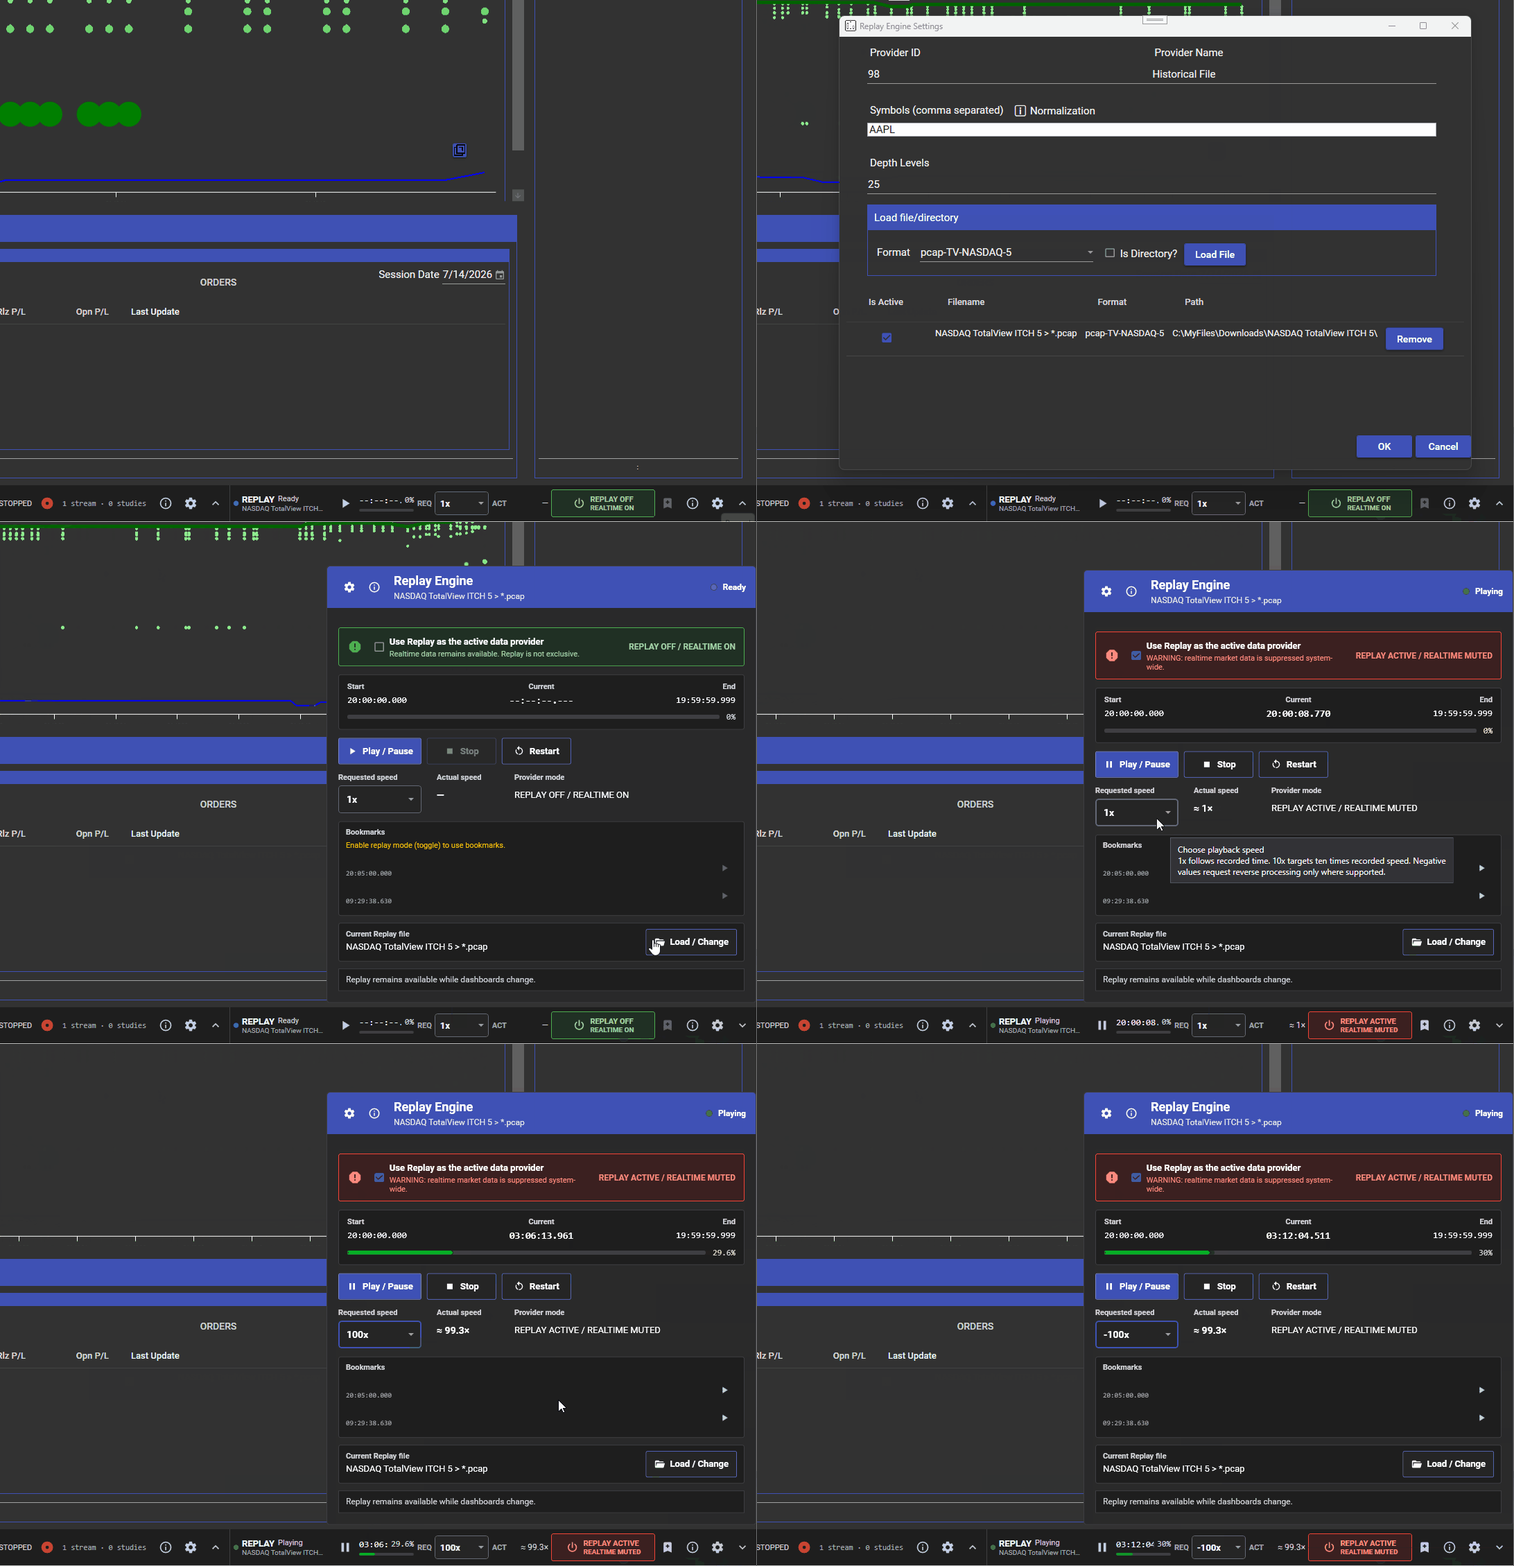
Replay Engine
Replays captured historical market data — order books, trades, and execution reports — through the same pipeline live feeds use, so every study and chart runs on it unchanged.
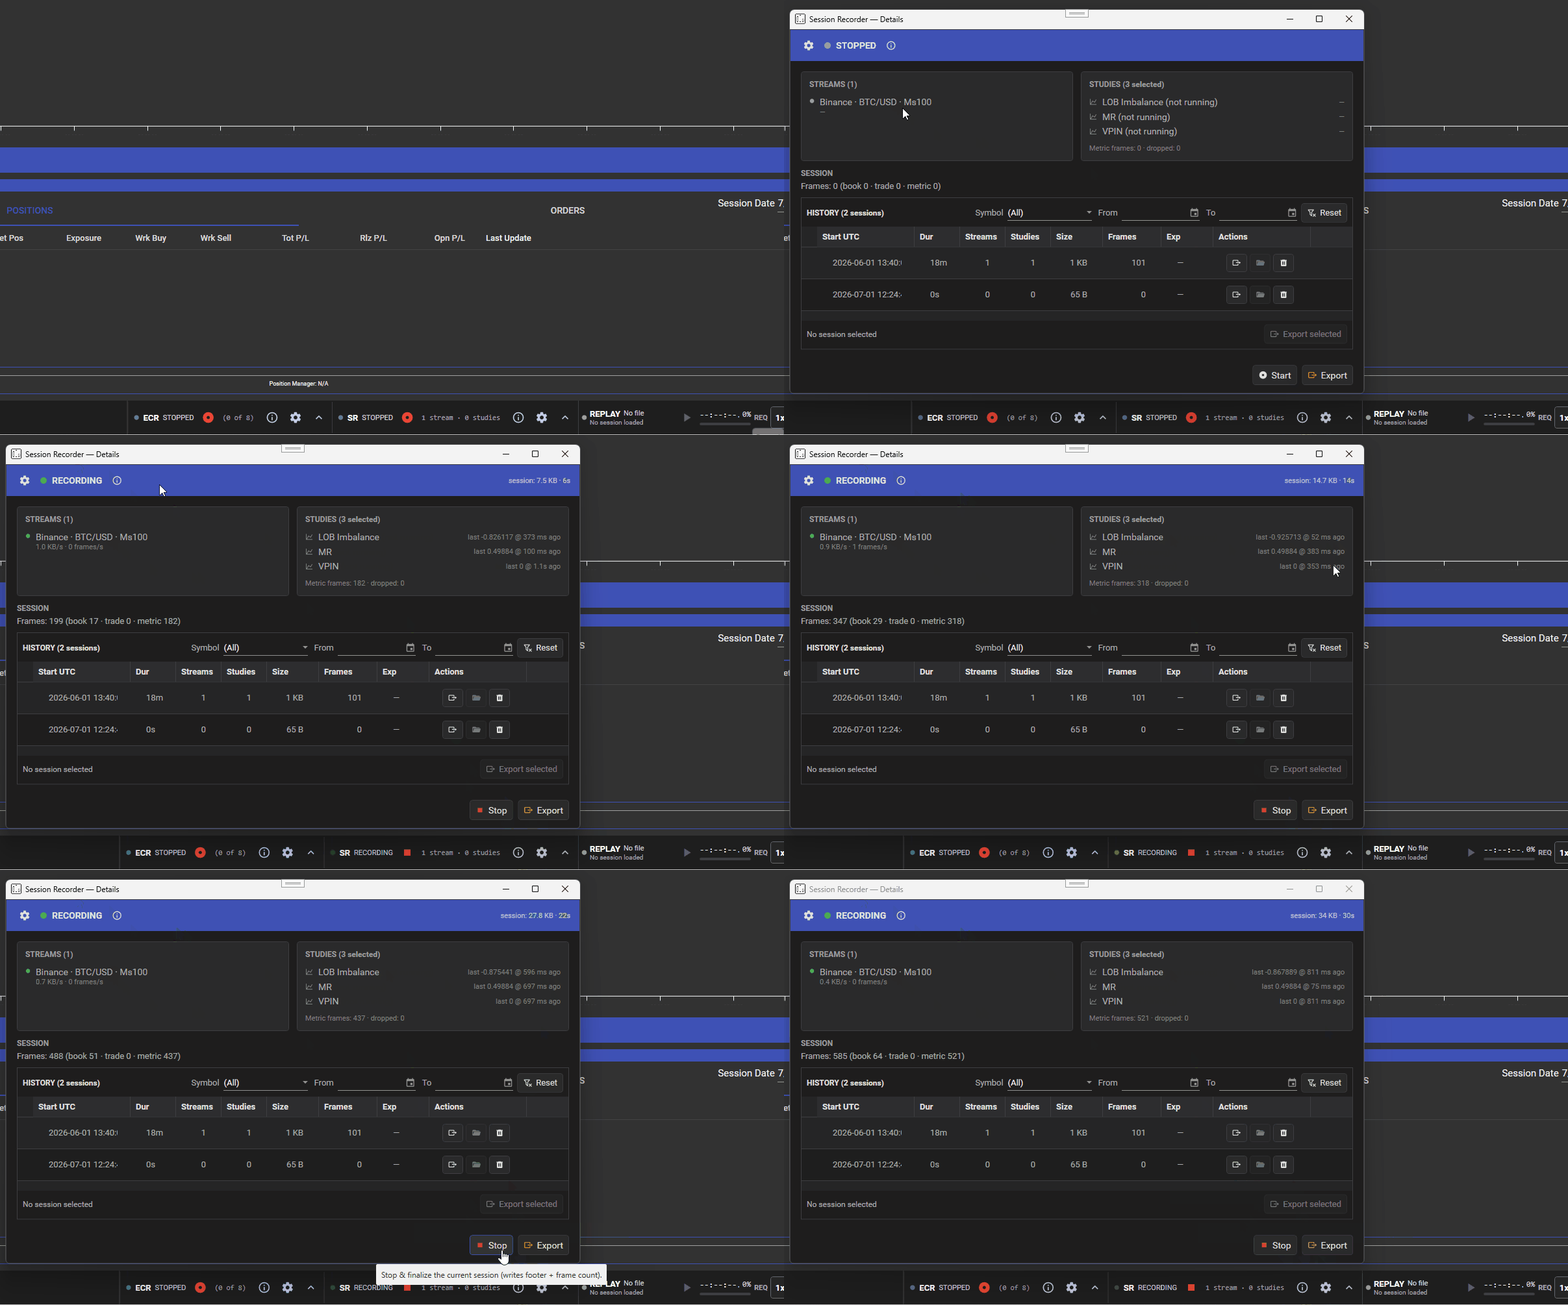
Session Recorder
Continuously captures live order book, trades, and selected study signals to a binary session file (.vhftsess) that can be replayed through the Replay Engine or exported to CSV or Parquet (long event stream or book-frame-aligned wide panel) for offline analysis.